4.3 KiB
Mining dashboards
Grafana dashboards for cryptocurrency miners.
Requirements
Dashboards rely on the following softwares:
- Telegraf to gather metrics (input) and write to a datastore (output)
- InfluxDB to store metrics on the long-term
- Grafana to visualize metrics
This stack is also known as the TIG stack.
Quickstart
Create infrastructure
Testing purpose only.
This guide uses Docker. Ensure you have docker, docker-compose and openssl binaries
installed.
Write your miner address, grafana and influxdb credentials:
cp -p docker/environment.example docker/environment
vi docker/environment
Generate a self-signed certificate:
openssl req -x509 -nodes -newkey rsa:2048 -keyout docker/ssl/my.key -out docker/ssl/my.crt -days 365
Press enter to every question.
Then start containers:
docker-compose up -d
See logs with:
docker-compose logs -f
Configure Telegraf
Telegraf inputs configurations are stored in telegraf directory. You can test them using the following command:
docker run --rm -e "MINER_ADDRESS=${MINER_ADDRESS}" \
    -v "${PWD}/docker/telegraf.conf:/etc/telegraf/telegraf.conf:ro" -v "${PWD}/telegraf:/etc/telegraf/telegraf.d:ro" \
    telegraf:1.15.4 telegraf -test -config /etc/telegraf/telegraf.conf -config-directory /etc/telegraf/telegraf.d
Example:
2021-02-02T14:39:57Z I! Starting Telegraf 1.15.4
> currencies,from=ETH,host=docker,to=EUR value=1171.49 1612276798000000000
> currencies,from=ETH,host=docker,to=USD value=1411.03 1612276798000000000
> flexpool_balance,host=docker,miner=0x3e2251567f87E4B6a3927158AF9c678ECa87a337 result=69375170480923064 1612276798000000000
> flexpool_workers,host=docker,miner=0x3e2251567f87E4B6a3927158AF9c678ECa87a337,name=rig1 effective_hashrate=86666666,invalid_shares=0,reported_hashrate=96304517,stale_shares=3,valid_shares=2008 1612276798000000000
> flexpool_daily_revenue_estimation,host=docker,miner=0x3e2251567f87E4B6a3927158AF9c678ECa87a337 result=6710141993155250 1612276798000000000
> flexpool_paid,host=docker,miner=0x3e2251567f87E4B6a3927158AF9c678ECa87a337 result=0 1612276798000000000
> flexpool_stats,host=docker,miner=0x3e2251567f87E4B6a3927158AF9c678ECa87a337 current_effective_hashrate=86666666,current_reported_hashrate=96304517,daily_effective_hashrate=92962962.625,daily_invalid_shares=0,daily_reported_hashrate=96286435.27777778,daily_stale_shares=3,daily_valid_shares=2008 1612276798000000000
Once you are confident with your configuration, reload the container:
docker-compose restart telegraf
Configure Grafana
Login
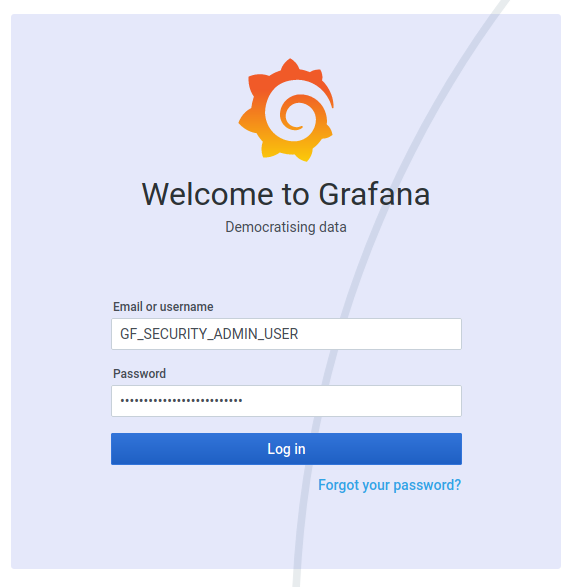
Go to Grafana URL. Login with credentials set in the "Create infrastructure" section.
Add a datasource
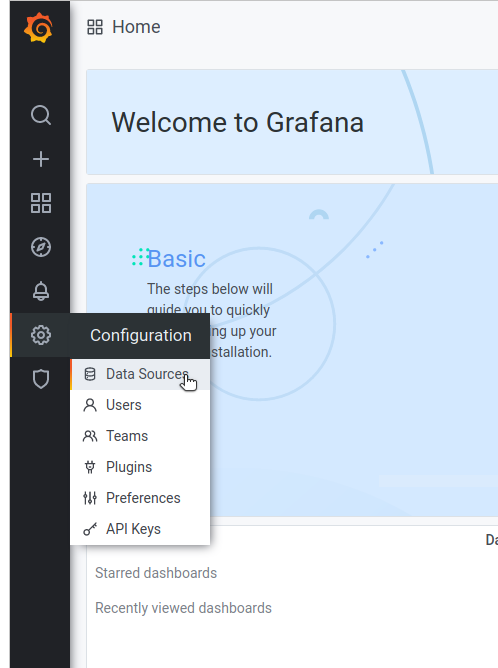
Go to Configuration, Data Sources:
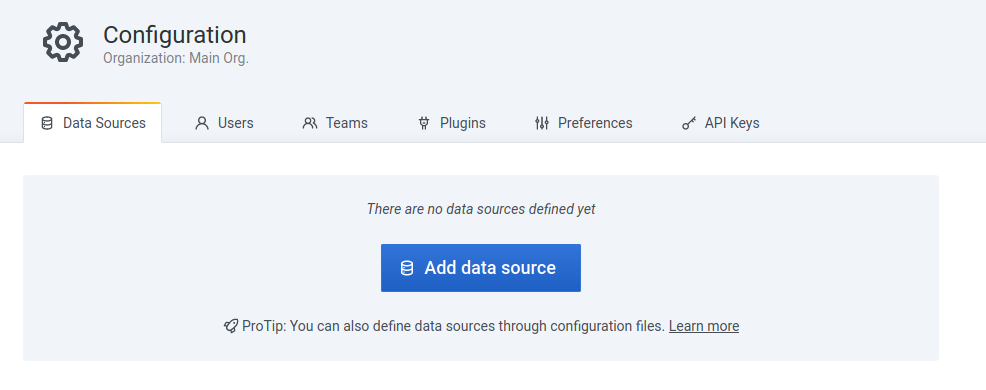
Select on Add data source:
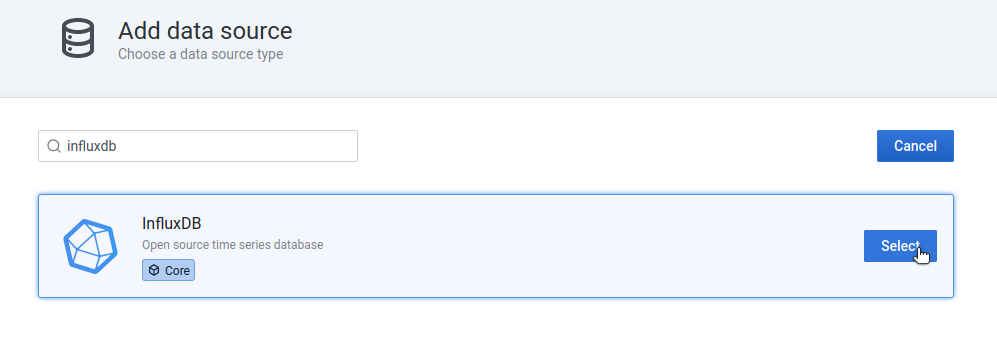
Search for InfluxDB:
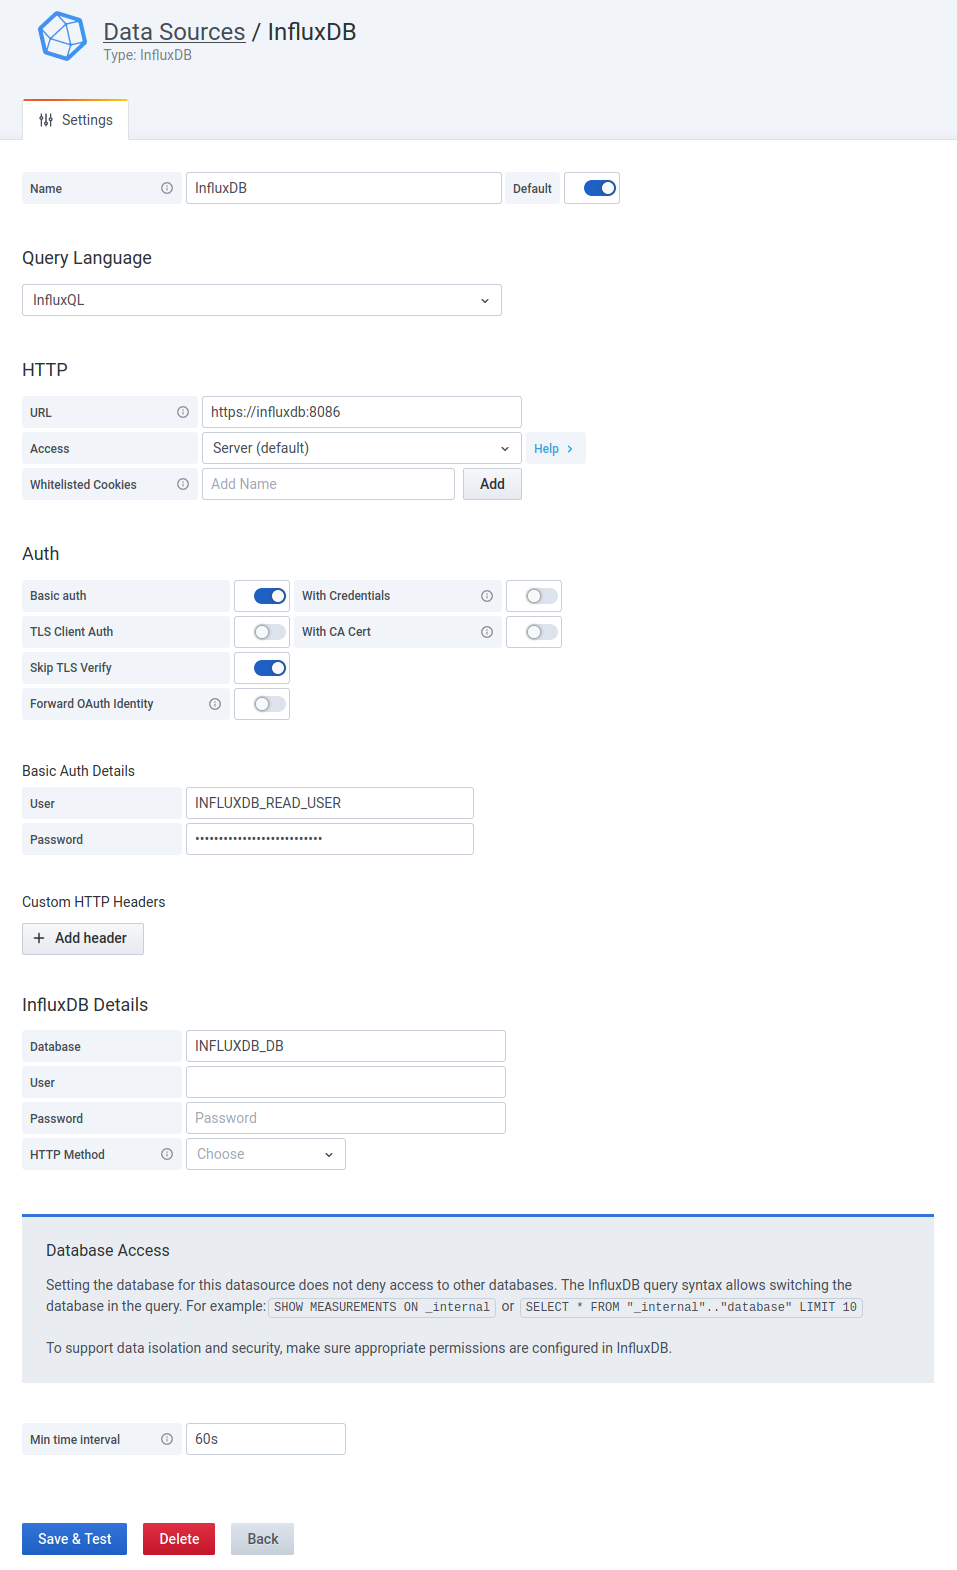
Then add read-only credentials to access the InfluxDB data store:
- Name:
InfluxDB - URL:
https://influxdb:8086 - Basic auth: enabled
- Skip TLS Verify: enabled
- User: defined by
INFLUXDB_READ_USER - Password: defined by
INFLUXDB_READ_USER_PASSWORD - Min time interval:
60s(Telegraf interval)
Click on Save & Test:
Import dashboard
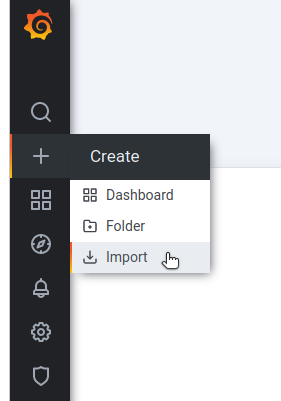
Click on Import:
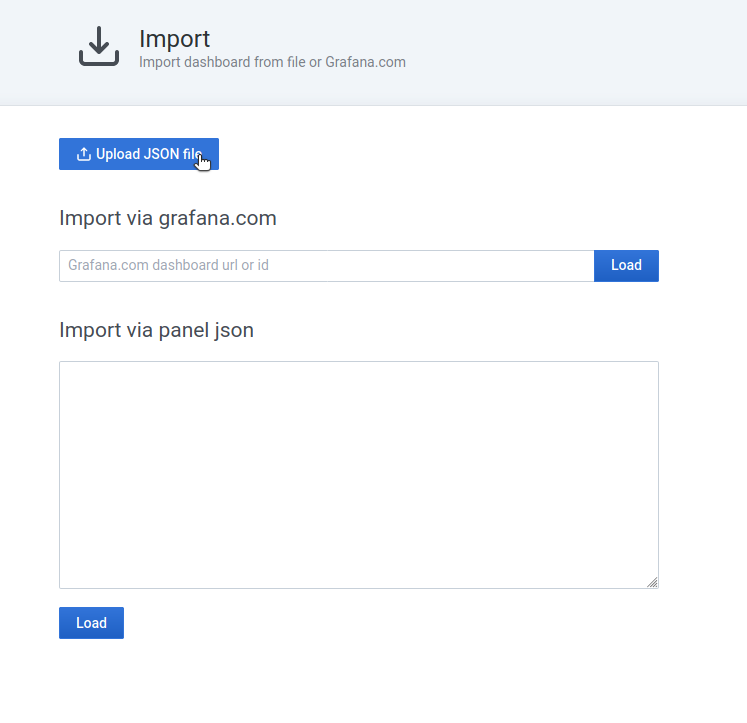
Then upload JSON file from this repository:
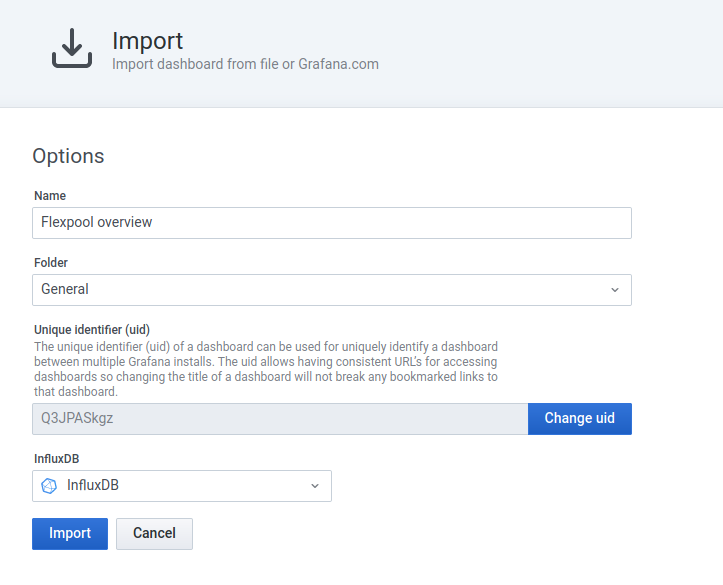
Select InfluxDB data source and click on Import:
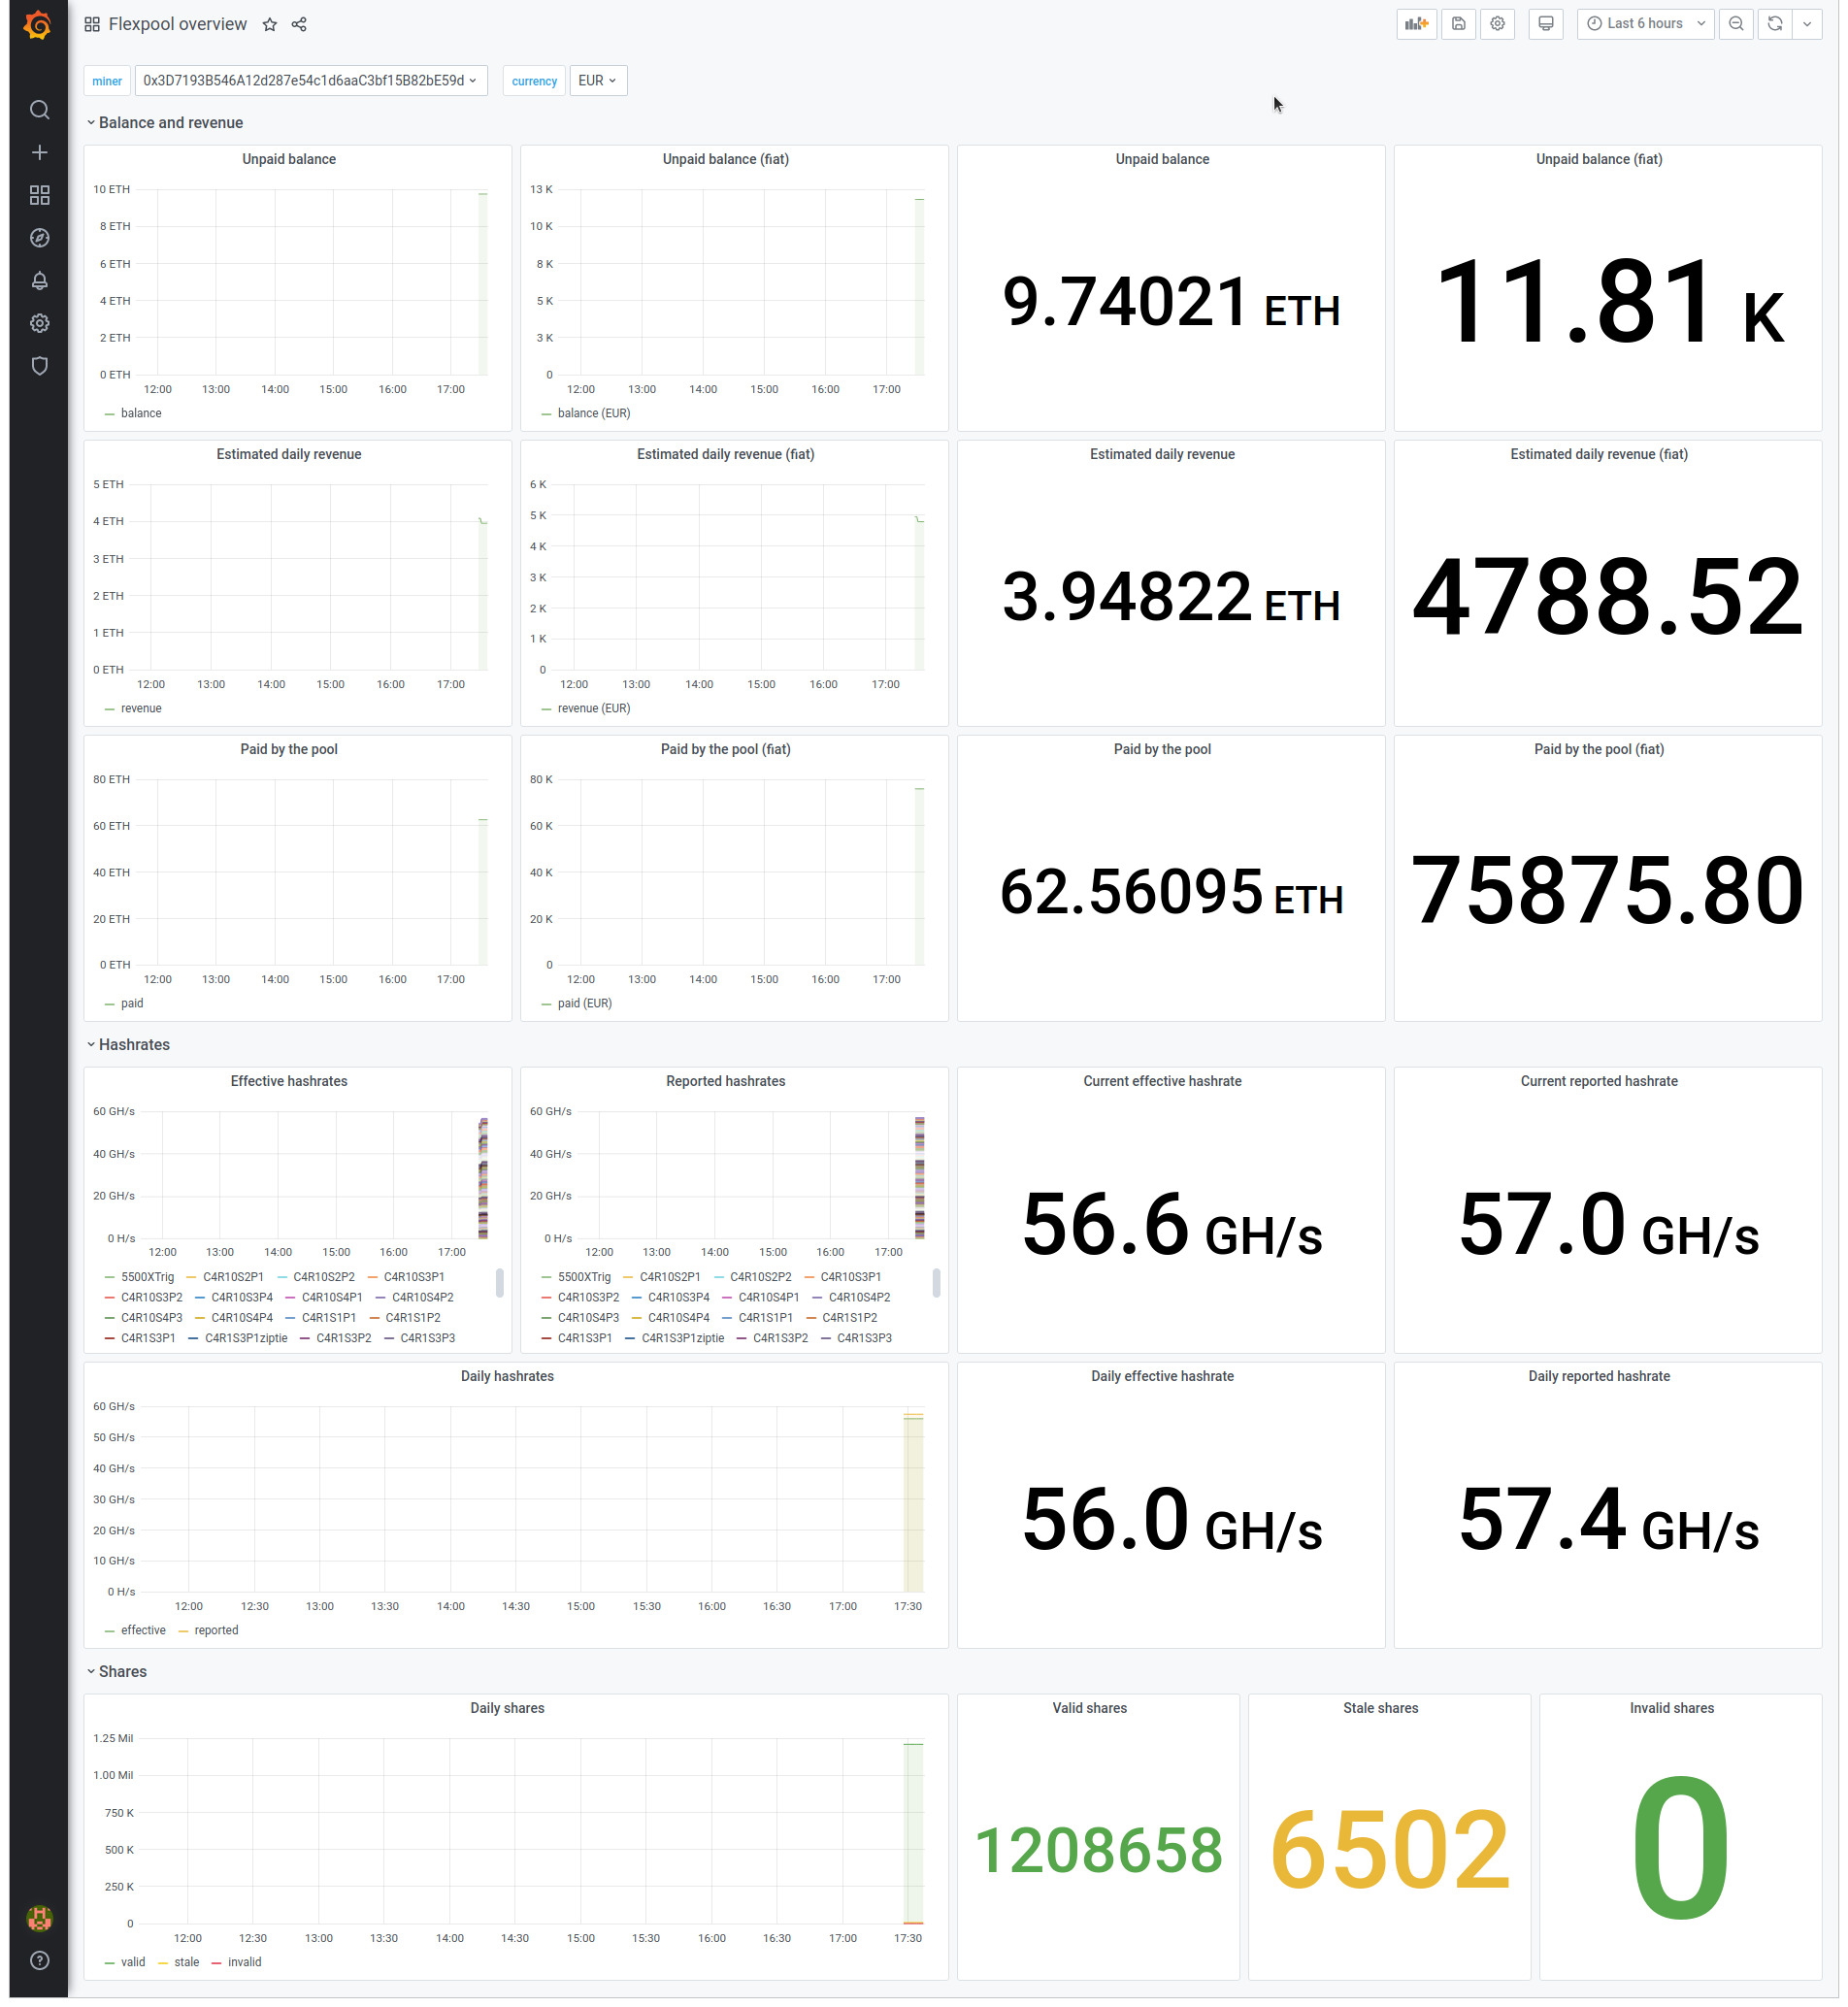
Your dashboard should be imported!
Repeat the operation for other dashboards if needed.
Remove infrastructure
Use docker-compose to remove containers and their volumes:
docker-compose down -v
Disclaimer
Telegraf is able to make API call on thrid-party services. Please read terms of service before going further. The repository owner cannot be responsible of any abuse.
