- Python 83.7%
- Jinja 16.3%
|
|
||
|---|---|---|
| docker | ||
| grafana | ||
| images | ||
| telegraf | ||
| .gitignore | ||
| docker-compose.yml | ||
| LICENSE | ||
| README.md | ||
END OF LIFE NOTICE
Flexpool.io was the main source of information for the mining dashboards and it has shut down. Due to the lack of activity on this repository for the last couple of years, I'm archiving it. Don't hesitate to fork it!
Mining dashboards
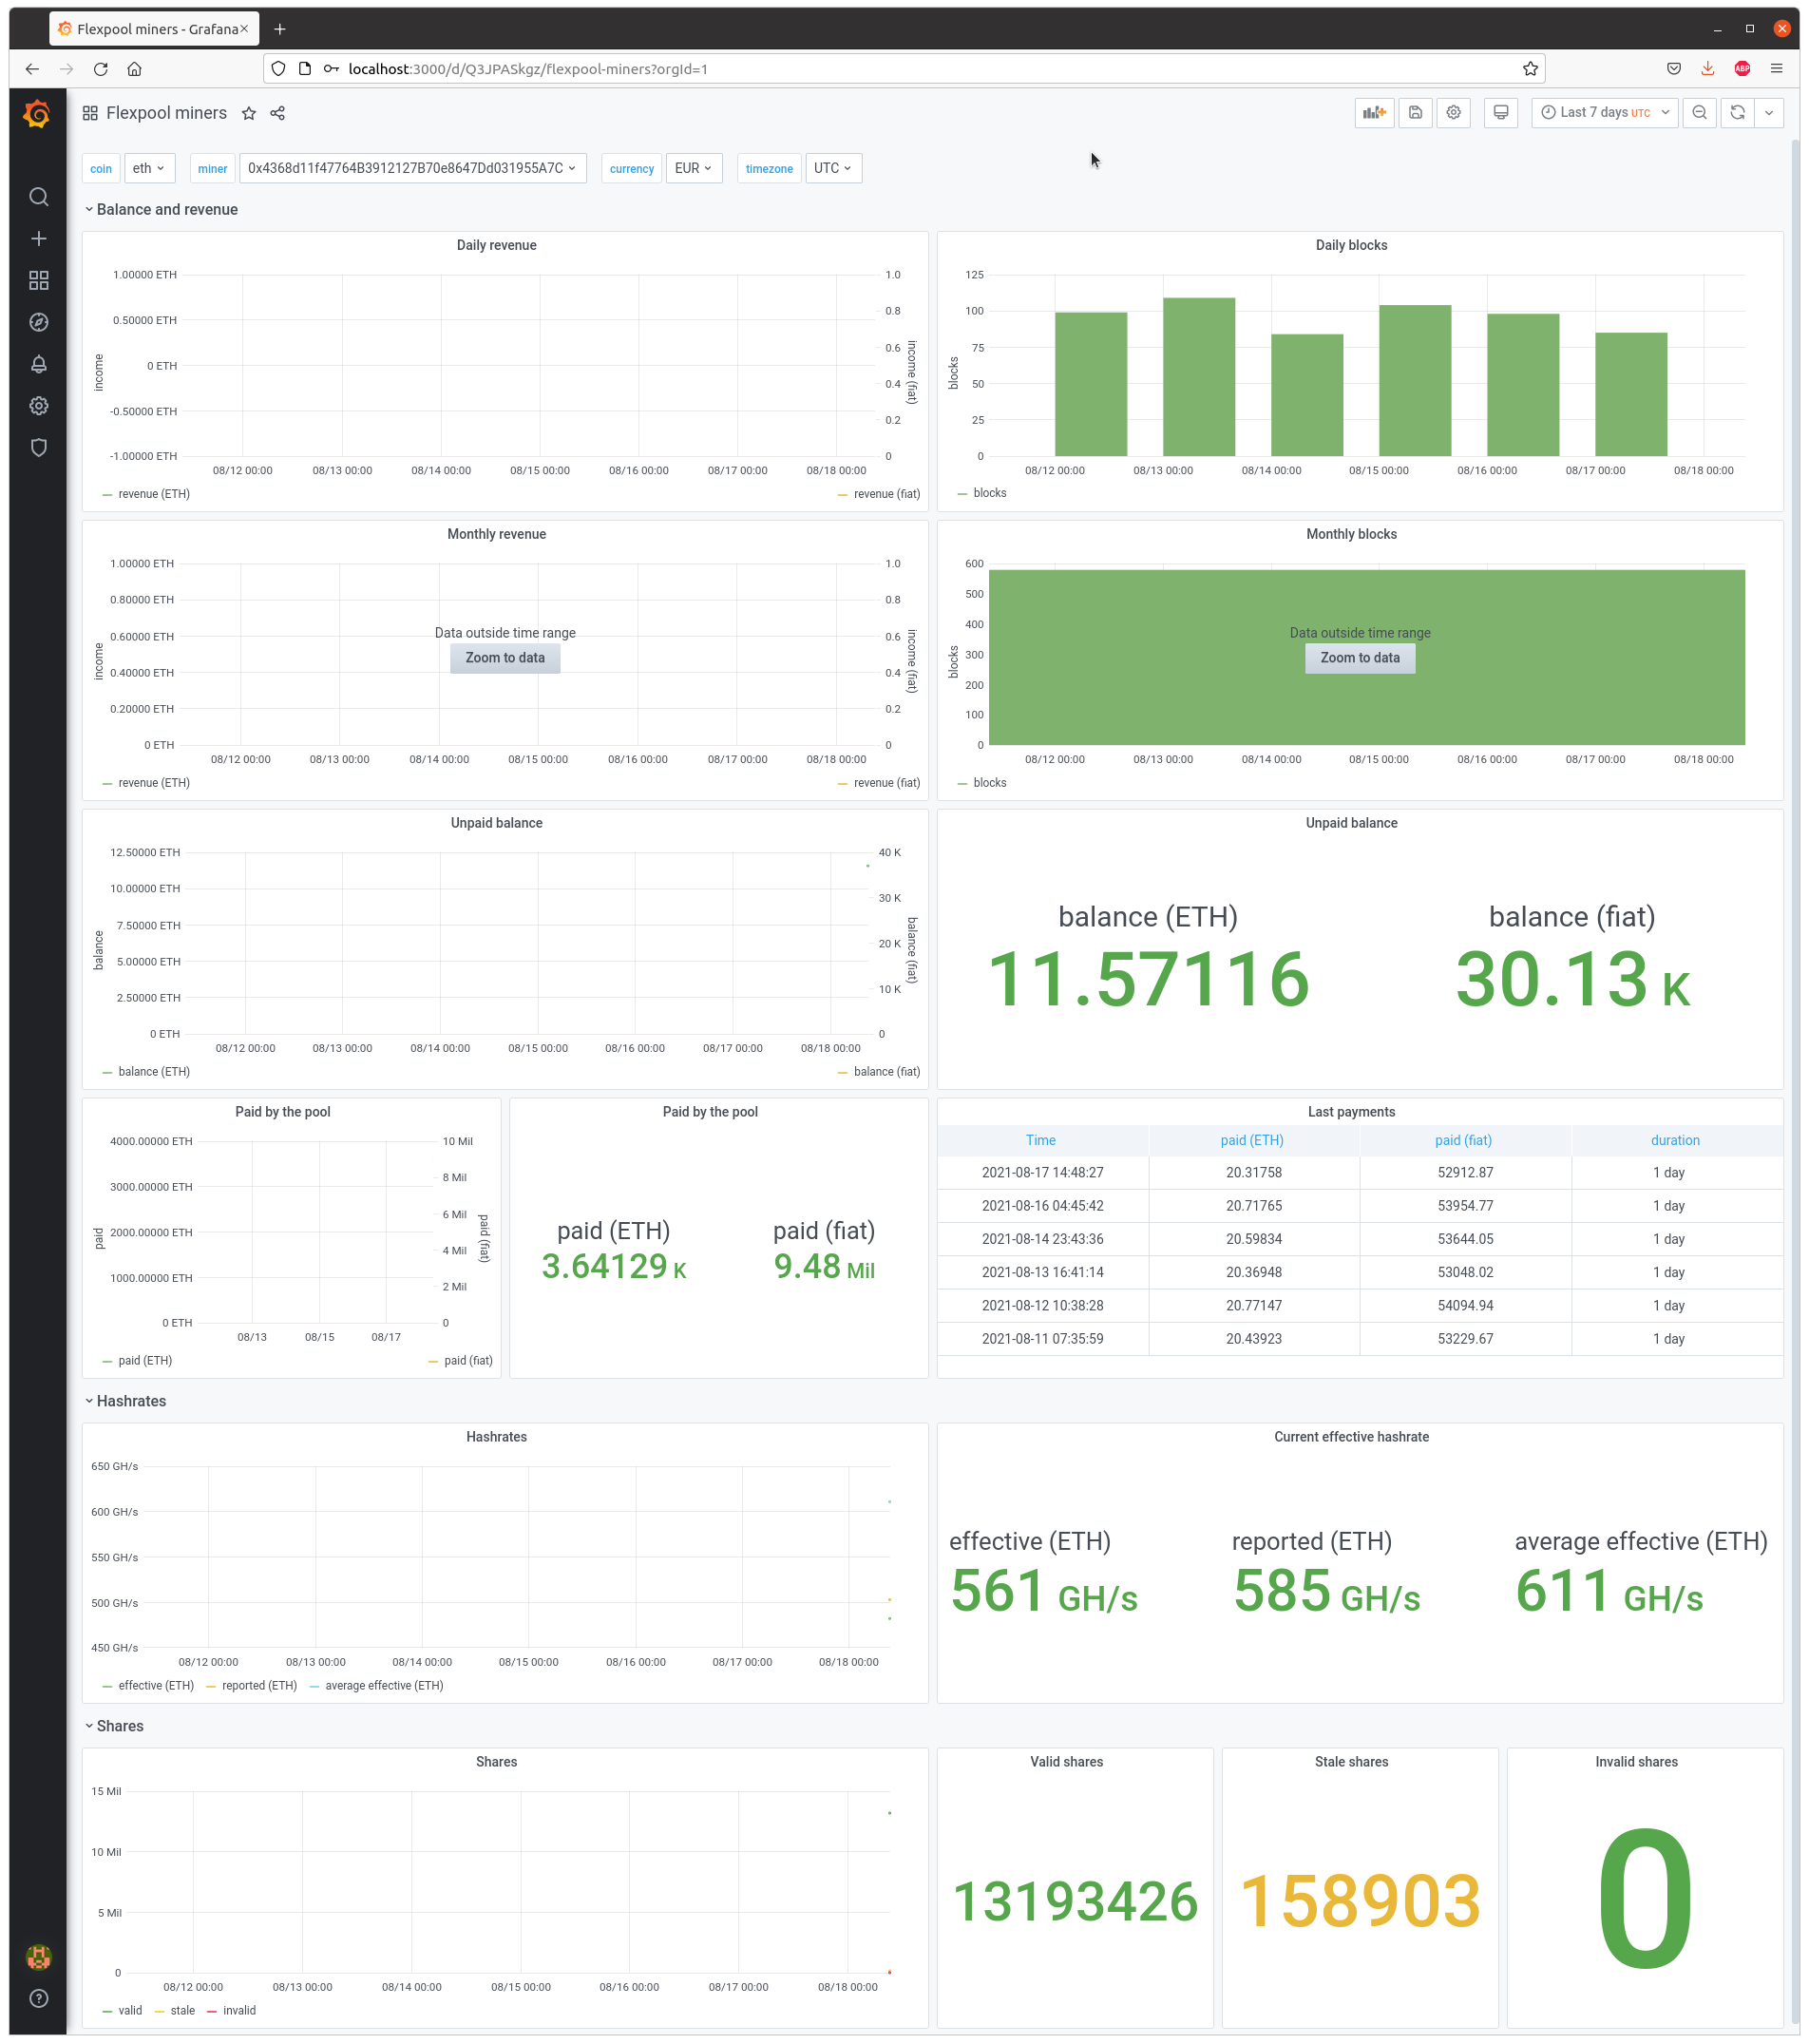
Grafana dashboards for cryptocurrency miners.
Requirements
Dashboards rely on the following softwares:
- Telegraf to gather metrics (input) and write to a datastore (output)
- InfluxDB to store metrics on the long-term
- Grafana to visualize metrics
This stack is also known as the TIG stack.
Quickstart
Create infrastructure
Testing purpose only.
This guide uses Docker. Ensure you have docker, docker-compose and openssl binaries
installed.
Write grafana and influxdb credentials:
cp -p docker/environment.example docker/environment
vi docker/environment
Depending on inputs, you should also set the miner address and HiveOS token.
Generate a self-signed certificate:
openssl req -x509 -nodes -newkey rsa:2048 -keyout docker/ssl/my.key -out docker/ssl/my.crt -days 365
Press enter to every question.
Then start containers:
docker-compose up -d
See logs with:
docker-compose logs -f
Configure Telegraf
Telegraf inputs configurations are stored in telegraf directory. You can test them using the following command:
docker run --rm -e "MINER_ADDRESS=${MINER_ADDRESS}" -e "COIN=${COIN}" \
    -v "${PWD}/docker/telegraf.conf:/etc/telegraf/telegraf.conf:ro" -v "${PWD}/telegraf:/etc/telegraf/telegraf.d:ro" \
    telegraf:1.19.2 telegraf -test -config /etc/telegraf/telegraf.conf -config-directory /etc/telegraf/telegraf.d
Example:
2021-08-18T09:05:45Z I! Starting Telegraf 1.19.2
> flexpool_pool_workers_count,coin=eth,host=docker result=43022 1629277546000000000
> flexpool_pool_blocks,coin=eth,host=docker,miner=0x80072FDaB52a9BED1f77A4f47CE8590eCF2d69Dd difficulty=8038304869759675,luck=0.2723280636238729,mevReward=74193593913914900,number=13046195,reward=2244945505143161600,roundTime=266,staticBlockReward=2000000000000000000,txFeeReward=170751911229246620 1629248941000000000
> flexpool_pool_blocks,coin=eth,host=docker,miner=0xc0224A1F6B7296598a09746b4106612562248F02 difficulty=8018674568139472,luck=0.9997781967425715,mevReward=0,number=13046171,reward=2093729787481399800,roundTime=969,staticBlockReward=2000000000000000000,txFeeReward=93729787481399740 1629248676000000000
> flexpool_pool_blocks,coin=eth,host=docker,miner=0xbe6Fa3d44e4fD10fE05d8e90fD820d1f16EEd9e2 difficulty=8069770590952829,luck=0.7709800334318287,mevReward=56831219018865630,number=13046106,reward=2162018055750582000,roundTime=753,staticBlockReward=2000000000000000000,txFeeReward=105186836731716500 1629247706000000000
> flexpool_pool_blocks,coin=eth,host=docker,miner=0xbF846283Ab2BE655844807FB9DbA086AF202a4d2 difficulty=8046149393032298,luck=1.4665340430067546,mevReward=29415246569886180,number=13046045,reward=2072298444980926500,roundTime=1425,staticBlockReward=2000000000000000000,txFeeReward=42883198411040420 1629246953000000000
> flexpool_pool_blocks,coin=eth,host=docker,miner=0xdF44B7Dce392a0267f315c2c7711200c9620981C difficulty=8050114629713925,luck=1.66199322809835,mevReward=0,number=13045942,reward=2141479945370403800,roundTime=1612,staticBlockReward=2000000000000000000,txFeeReward=141479945370403760 1629245528000000000
> flexpool_pool_blocks,coin=eth,host=docker,miner=0xE1E5372F00Fe6b05FD89c8110D4a29b29B916a7d difficulty=8109240971665971,luck=0.9366252682018412,mevReward=15080560933545792,number=13045830,reward=2088916235271470600,roundTime=918,staticBlockReward=2000000000000000000,txFeeReward=73835674337924700 1629243916000000000
Once you are confident with your configuration, reload the container:
docker-compose restart telegraf
Configure Grafana
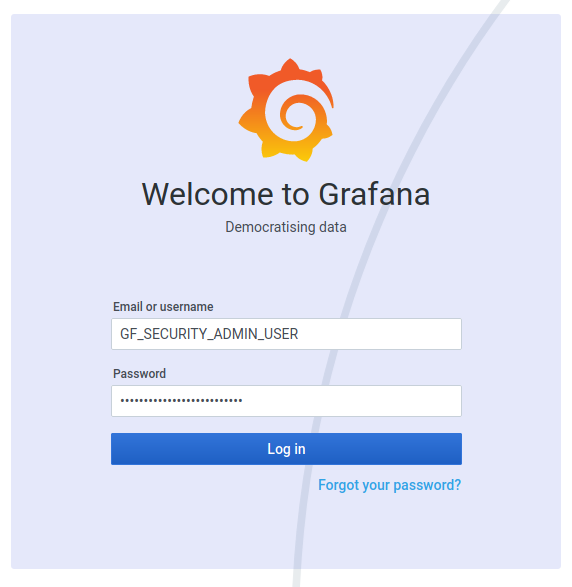
Login
Go to Grafana URL. Login with credentials set in the "Create infrastructure" section.
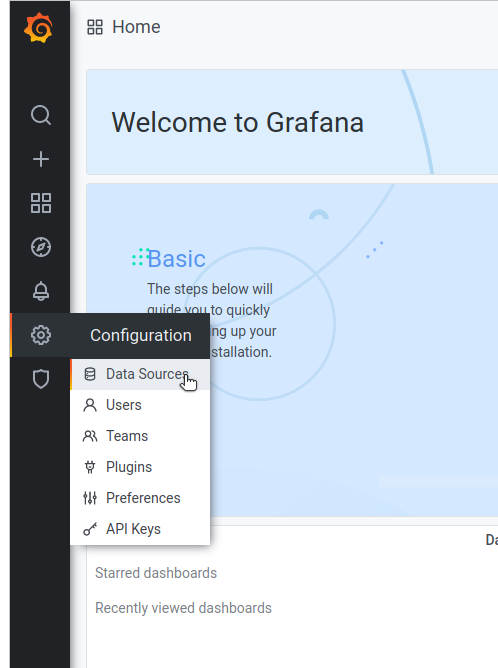
Add a datasource
Go to Configuration, Data Sources:
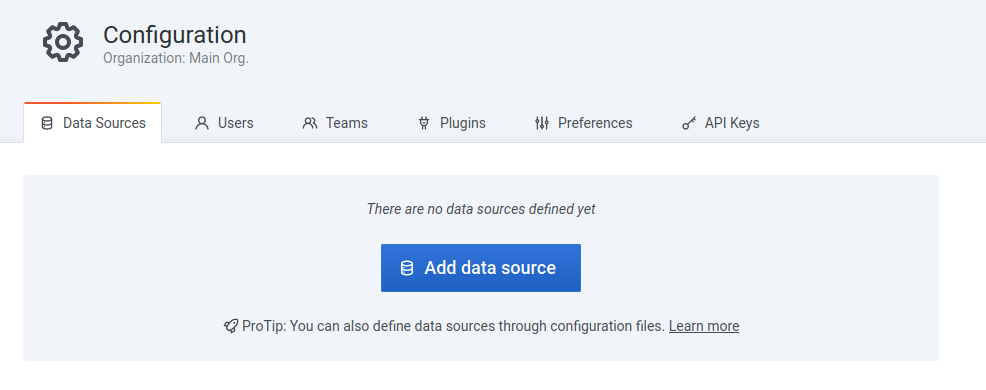
Select on Add data source:
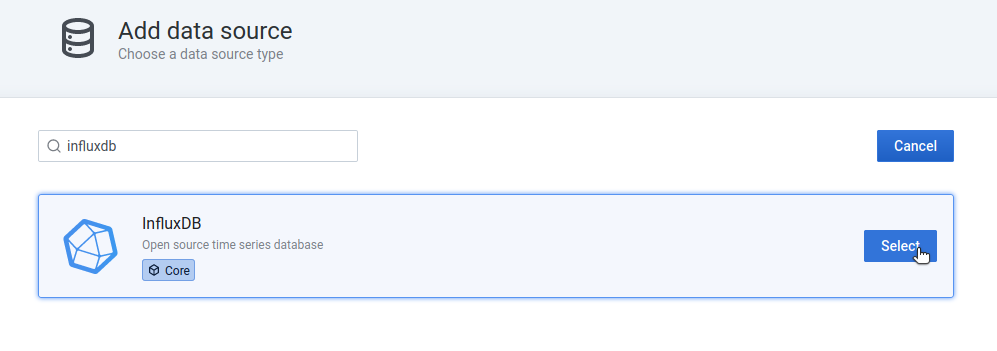
Search for InfluxDB:
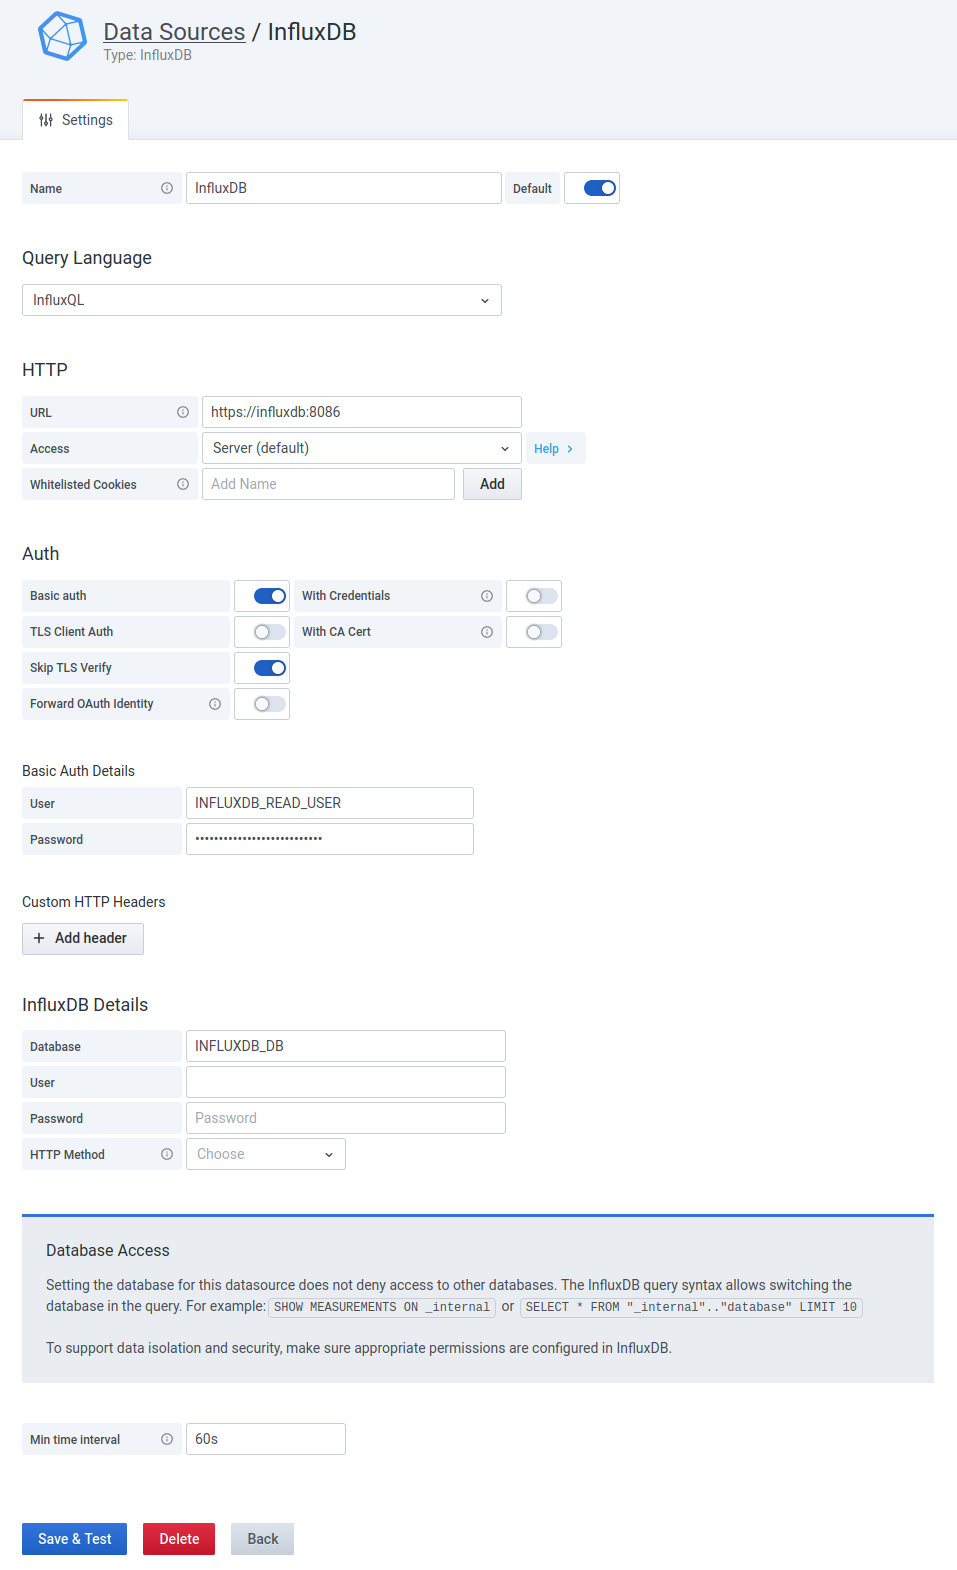
Then add read-only credentials to access the InfluxDB data store:
- Name:
InfluxDB - URL:
https://influxdb:8086 - Basic auth: enabled
- Skip TLS Verify: enabled
- User: defined by
INFLUXDB_READ_USER - Password: defined by
INFLUXDB_READ_USER_PASSWORD - Min time interval:
60s(Telegraf interval)
Click on Save & Test:
Import dashboard
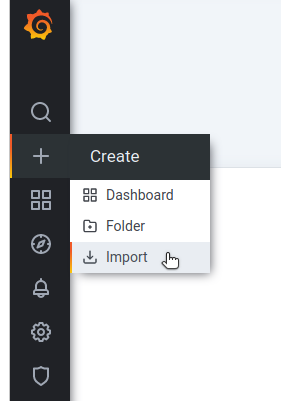
Click on Import:
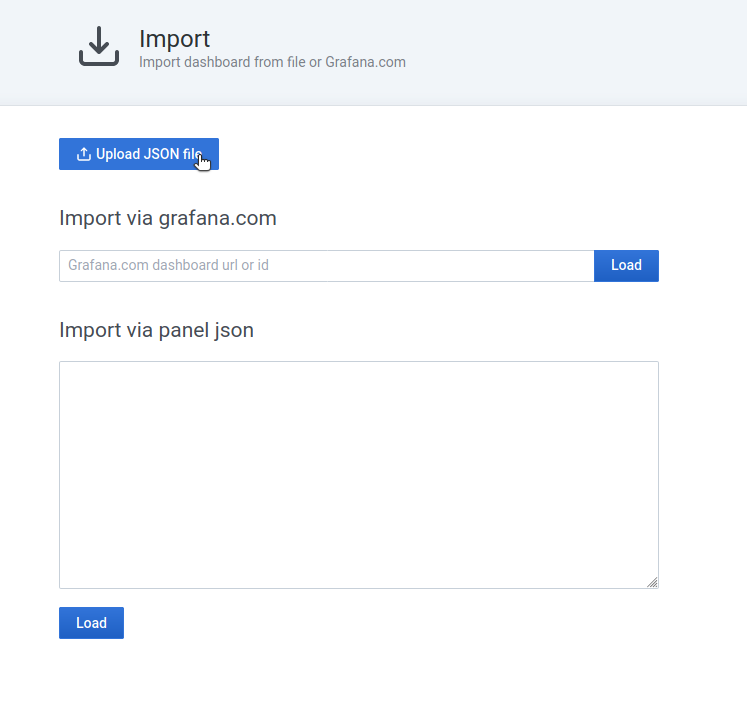
Then upload JSON file from this repository:
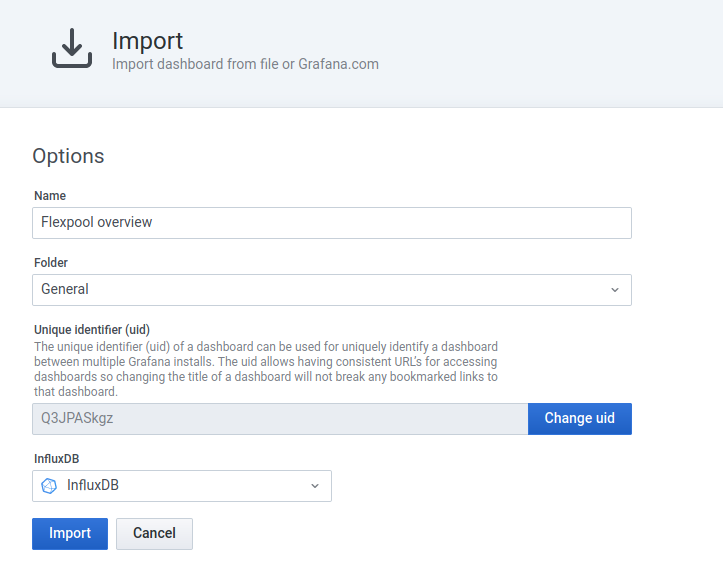
Select InfluxDB data source and click on Import:
Your dashboard should be imported!
Repeat the operation for other dashboards if needed.
Remove infrastructure
Use docker-compose to remove containers and their volumes:
docker-compose down -v
Disclaimer
Telegraf is able to make API call on thrid-party services. Please read terms of service before going further. The repository owner cannot be responsible of any abuse.
