- Python 83.7%
- Jinja 16.3%
|
|
||
|---|---|---|
| docker | ||
| grafana | ||
| images | ||
| telegraf | ||
| .gitignore | ||
| docker-compose.yml | ||
| LICENSE | ||
| README.md | ||
Mining dashboards
Grafana dashboards for cryptocurrency miners.
Requirements
Dashboards rely on the following softwares:
- Telegraf to gather metrics (input) and write to a datastore (output)
- InfluxDB to store metrics on the long-term
- Grafana to visualize metrics
This stack is also known as the TIG stack.
Quickstart
Create infrastructure
Testing purpose only.
This guide uses Docker. Ensure you have docker, docker-compose and openssl binaries
installed.
Write grafana and influxdb credentials:
cp -p docker/environment.example docker/environment
vi docker/environment
Depending on inputs, you should also set the miner address and HiveOS token.
Generate a self-signed certificate:
openssl req -x509 -nodes -newkey rsa:2048 -keyout docker/ssl/my.key -out docker/ssl/my.crt -days 365
Press enter to every question.
Then start containers:
docker-compose up -d
See logs with:
docker-compose logs -f
Configure Telegraf
Telegraf inputs configurations are stored in telegraf directory. You can test them using the following command:
docker run --rm -e "MINER_ADDRESS=${MINER_ADDRESS}" -e "COIN=${COIN}" \
    -v "${PWD}/docker/telegraf.conf:/etc/telegraf/telegraf.conf:ro" -v "${PWD}/telegraf:/etc/telegraf/telegraf.d:ro" \
    telegraf:1.19.2 telegraf -test -config /etc/telegraf/telegraf.conf -config-directory /etc/telegraf/telegraf.d
Example:
2021-08-18T09:05:45Z I! Starting Telegraf 1.19.2
> flexpool_pool_workers_count,coin=eth,host=docker result=43022 1629277546000000000
> flexpool_pool_blocks,coin=eth,host=docker,miner=0x80072FDaB52a9BED1f77A4f47CE8590eCF2d69Dd difficulty=8038304869759675,luck=0.2723280636238729,mevReward=74193593913914900,number=13046195,reward=2244945505143161600,roundTime=266,staticBlockReward=2000000000000000000,txFeeReward=170751911229246620 1629248941000000000
> flexpool_pool_blocks,coin=eth,host=docker,miner=0xc0224A1F6B7296598a09746b4106612562248F02 difficulty=8018674568139472,luck=0.9997781967425715,mevReward=0,number=13046171,reward=2093729787481399800,roundTime=969,staticBlockReward=2000000000000000000,txFeeReward=93729787481399740 1629248676000000000
> flexpool_pool_blocks,coin=eth,host=docker,miner=0xbe6Fa3d44e4fD10fE05d8e90fD820d1f16EEd9e2 difficulty=8069770590952829,luck=0.7709800334318287,mevReward=56831219018865630,number=13046106,reward=2162018055750582000,roundTime=753,staticBlockReward=2000000000000000000,txFeeReward=105186836731716500 1629247706000000000
> flexpool_pool_blocks,coin=eth,host=docker,miner=0xbF846283Ab2BE655844807FB9DbA086AF202a4d2 difficulty=8046149393032298,luck=1.4665340430067546,mevReward=29415246569886180,number=13046045,reward=2072298444980926500,roundTime=1425,staticBlockReward=2000000000000000000,txFeeReward=42883198411040420 1629246953000000000
> flexpool_pool_blocks,coin=eth,host=docker,miner=0xdF44B7Dce392a0267f315c2c7711200c9620981C difficulty=8050114629713925,luck=1.66199322809835,mevReward=0,number=13045942,reward=2141479945370403800,roundTime=1612,staticBlockReward=2000000000000000000,txFeeReward=141479945370403760 1629245528000000000
> flexpool_pool_blocks,coin=eth,host=docker,miner=0xE1E5372F00Fe6b05FD89c8110D4a29b29B916a7d difficulty=8109240971665971,luck=0.9366252682018412,mevReward=15080560933545792,number=13045830,reward=2088916235271470600,roundTime=918,staticBlockReward=2000000000000000000,txFeeReward=73835674337924700 1629243916000000000
Once you are confident with your configuration, reload the container:
docker-compose restart telegraf
Configure Grafana
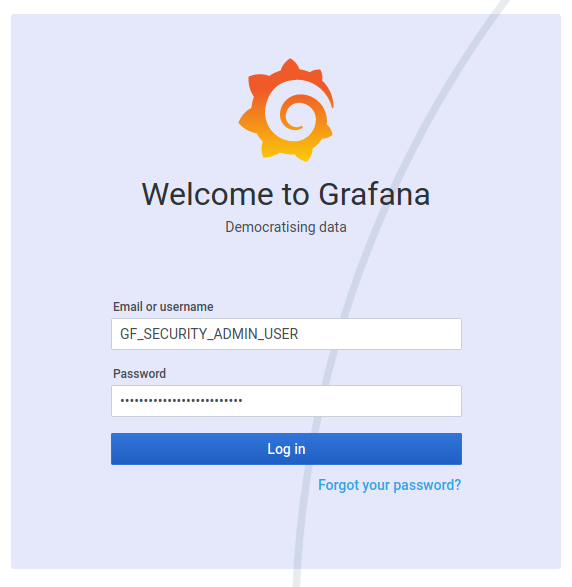
Login
Go to Grafana URL. Login with credentials set in the "Create infrastructure" section.
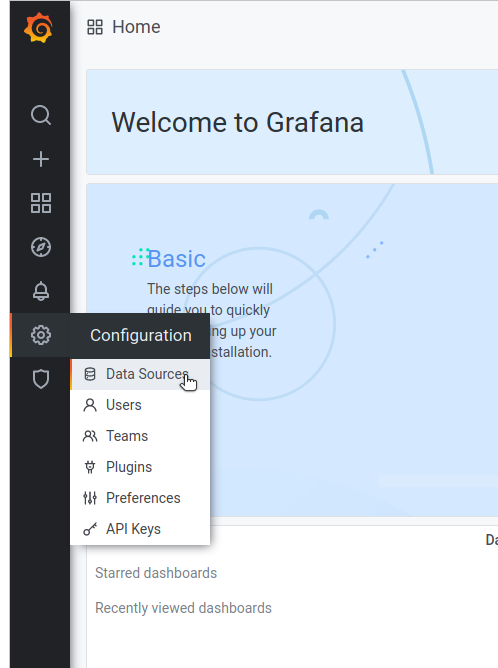
Add a datasource
Go to Configuration, Data Sources:
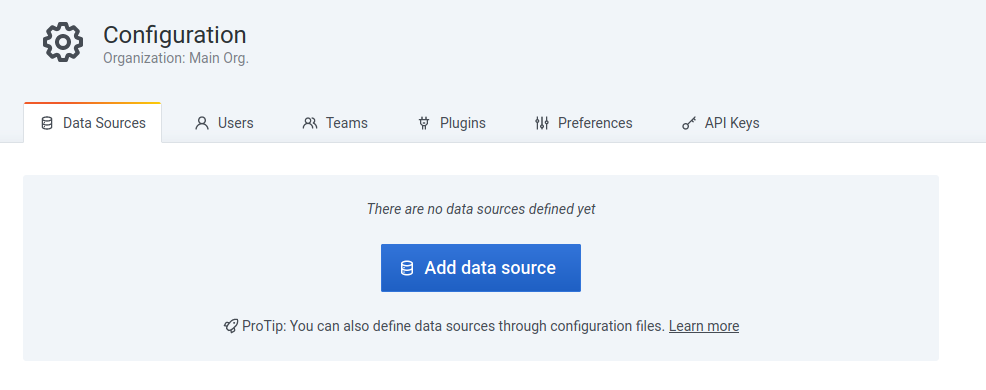
Select on Add data source:
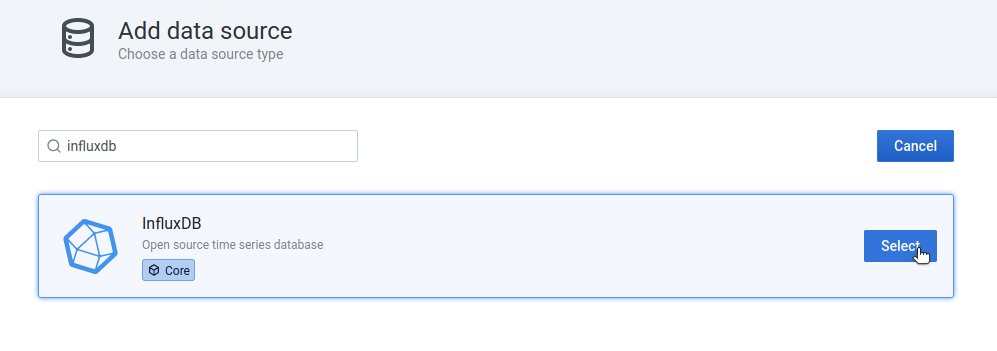
Search for InfluxDB:
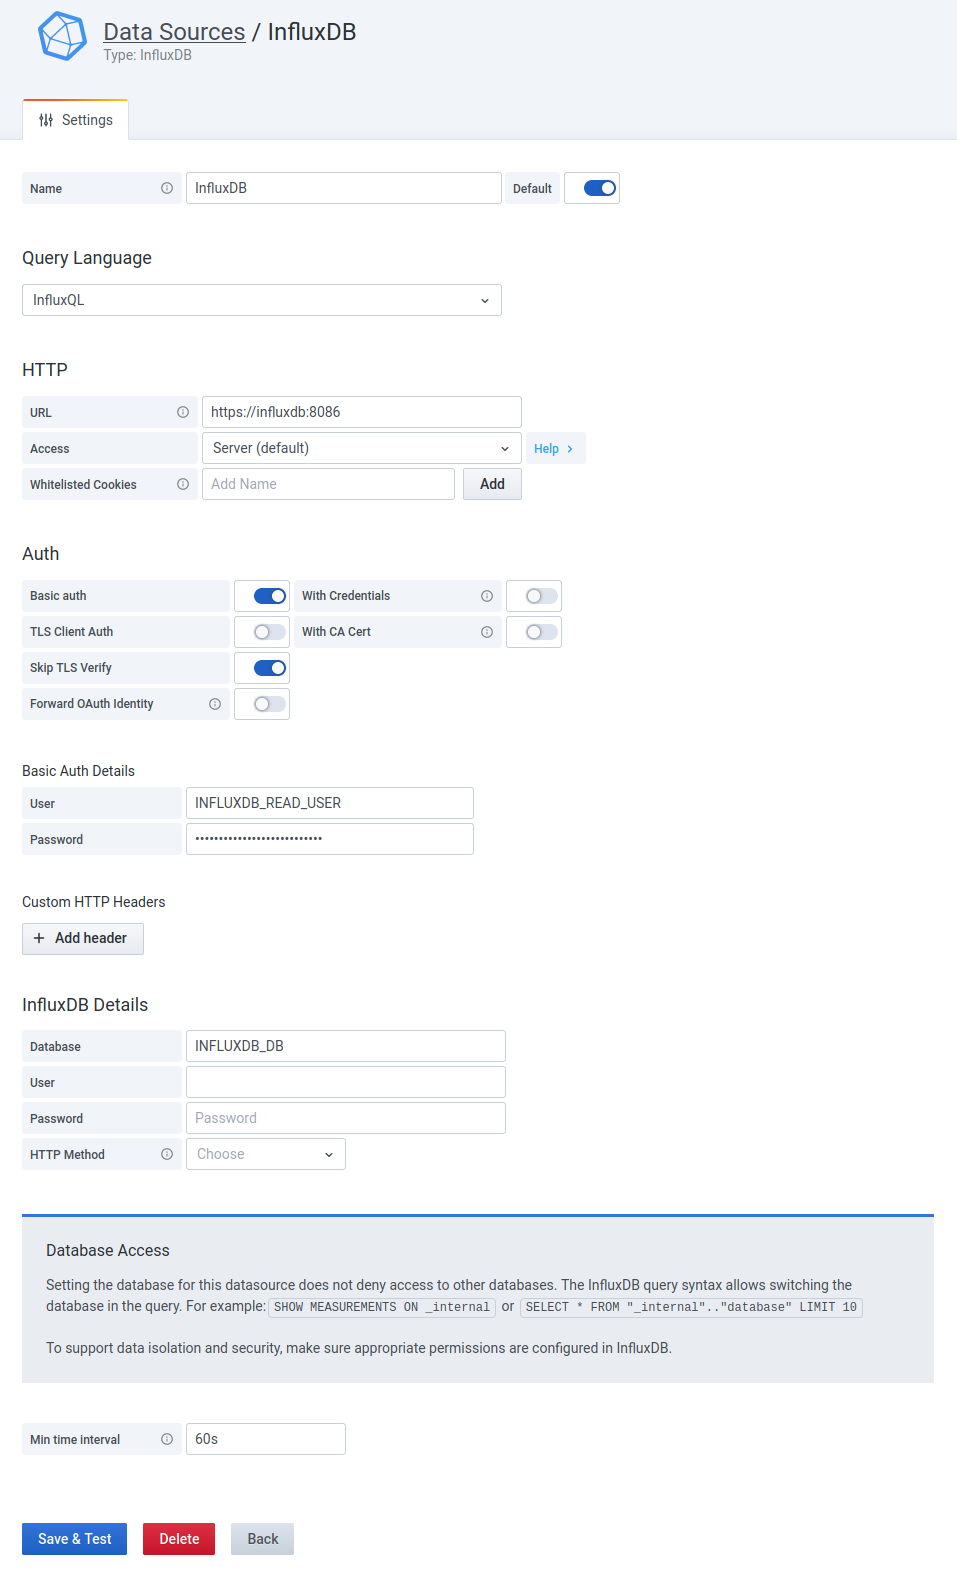
Then add read-only credentials to access the InfluxDB data store:
- Name:
InfluxDB - URL:
https://influxdb:8086 - Basic auth: enabled
- Skip TLS Verify: enabled
- User: defined by
INFLUXDB_READ_USER - Password: defined by
INFLUXDB_READ_USER_PASSWORD - Min time interval:
60s(Telegraf interval)
Click on Save & Test:
Import dashboard
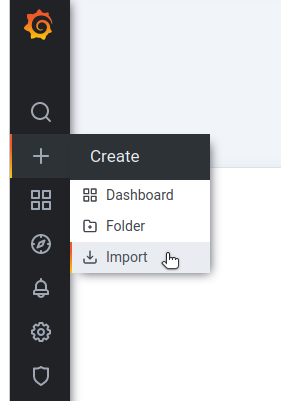
Click on Import:
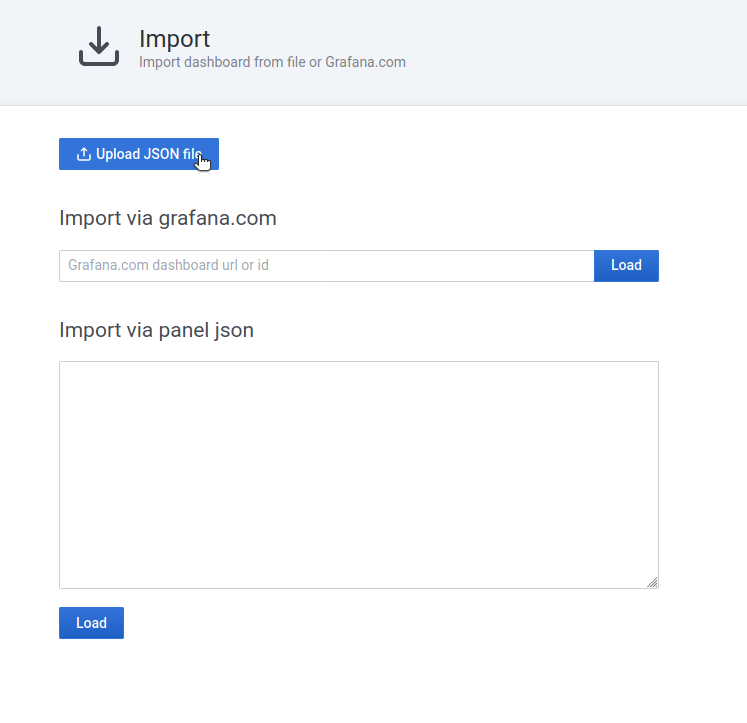
Then upload JSON file from this repository:
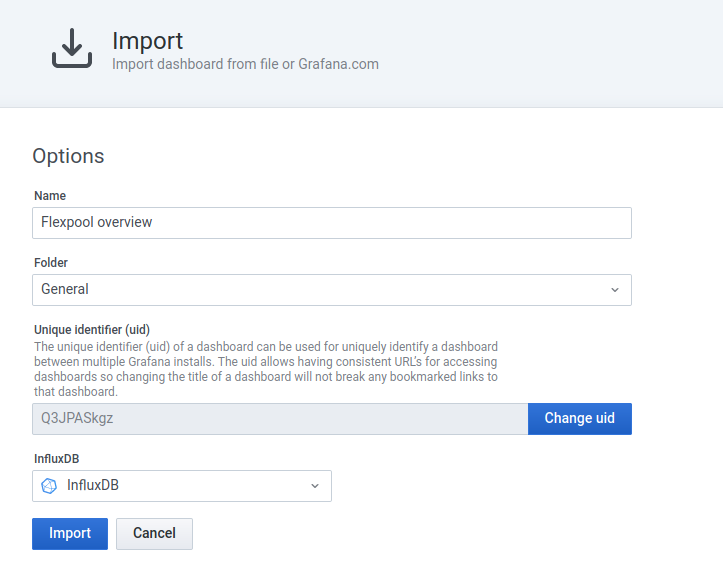
Select InfluxDB data source and click on Import:
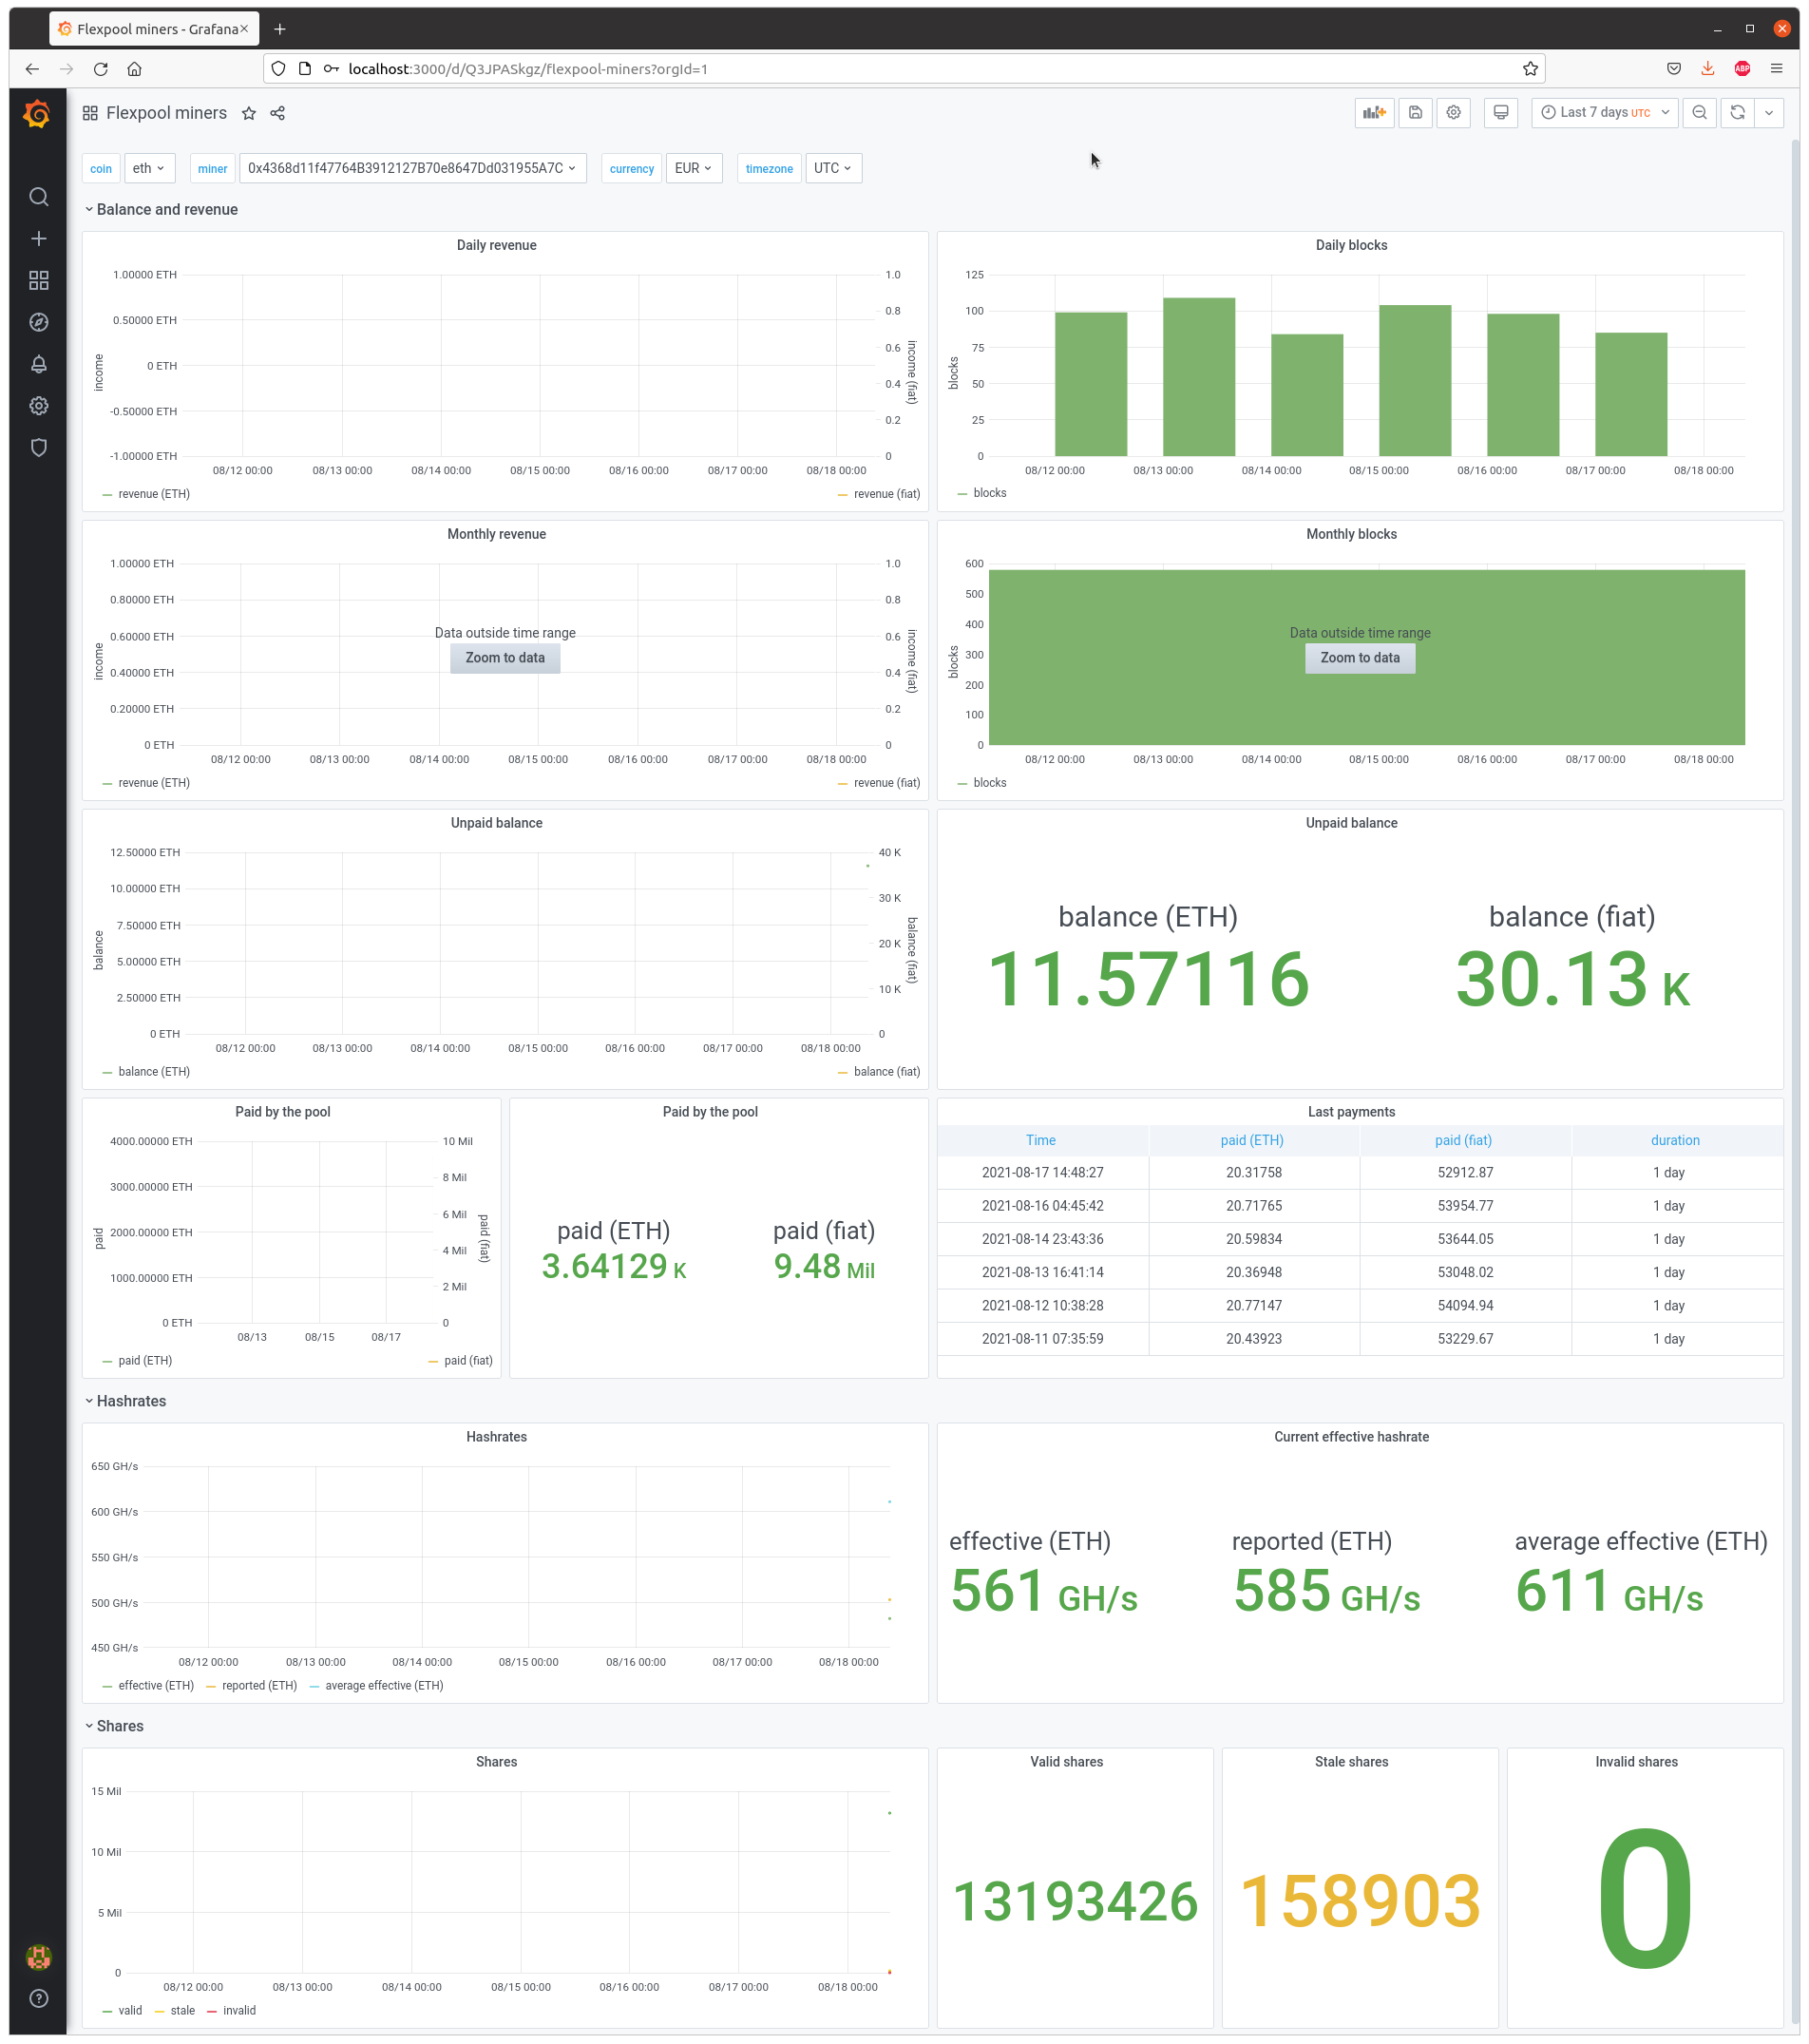
Your dashboard should be imported!
Repeat the operation for other dashboards if needed.
Remove infrastructure
Use docker-compose to remove containers and their volumes:
docker-compose down -v
Disclaimer
Telegraf is able to make API call on thrid-party services. Please read terms of service before going further. The repository owner cannot be responsible of any abuse.
