- Python 83.7%
- Jinja 16.3%
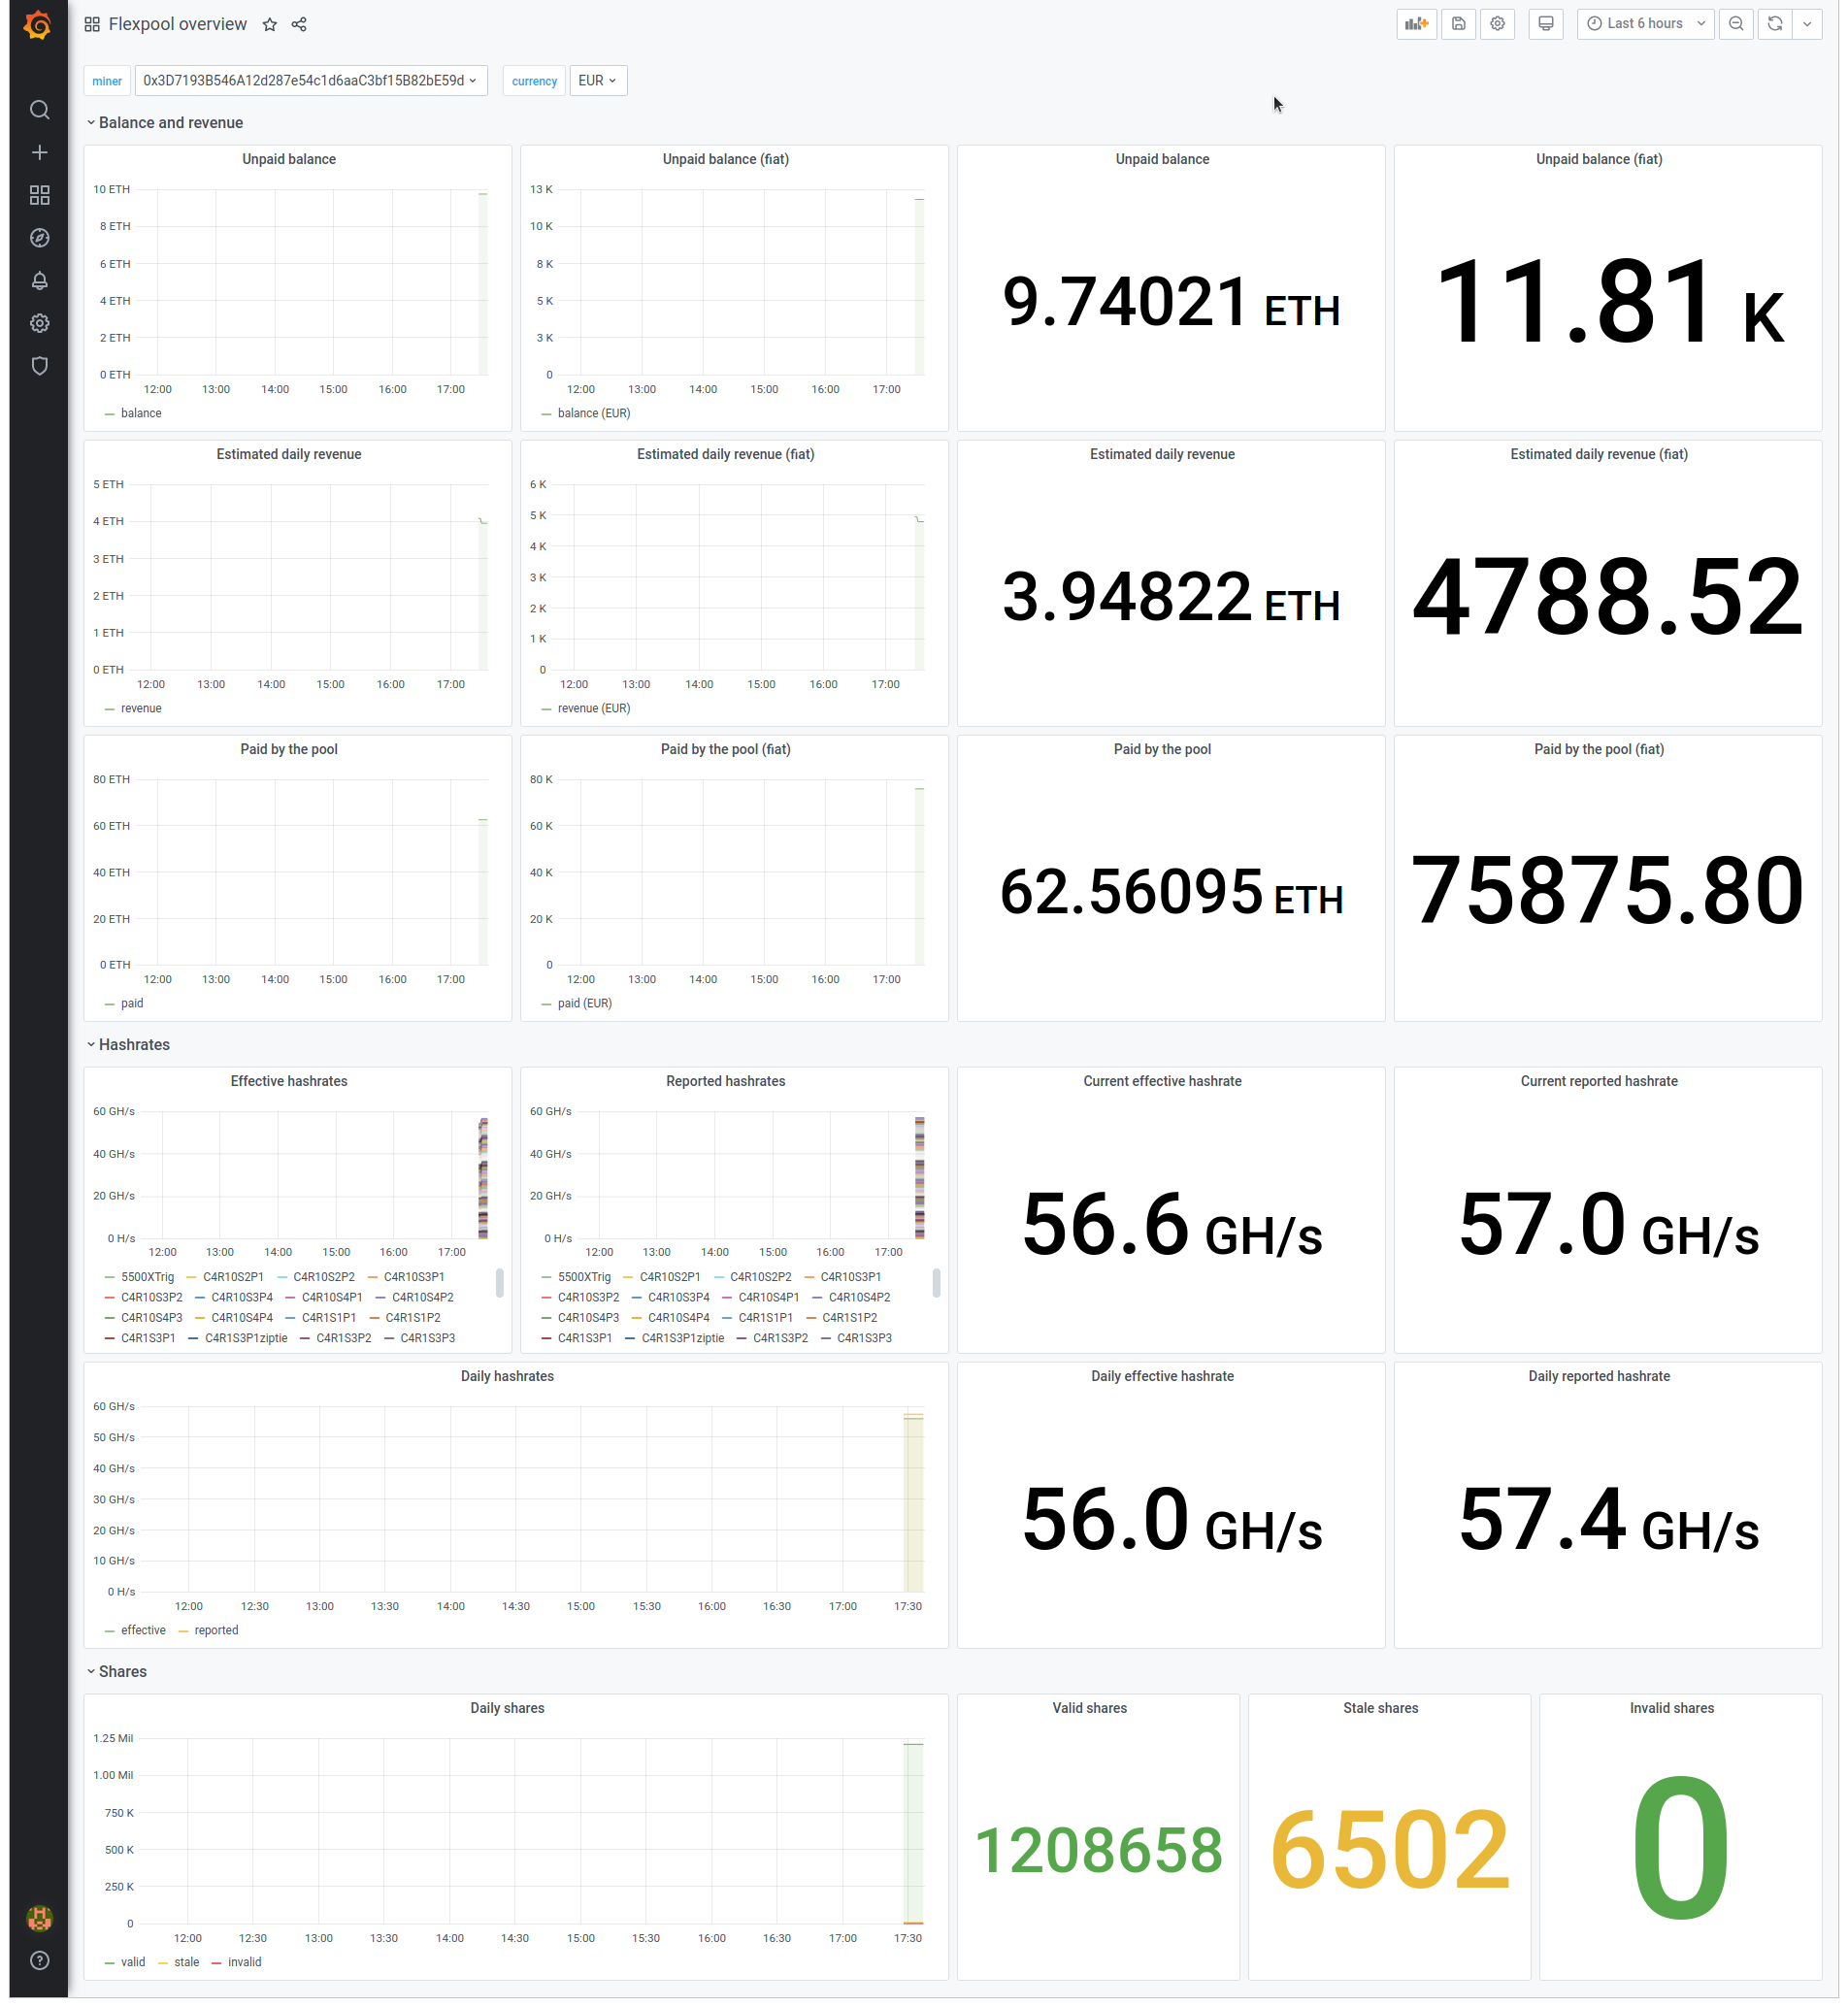
On Flexpool miners, workers and Etherscan dashboards, min, max and last computations where based on multiple small time intervals instead of the big time interval. Removing "group by" solved the computations. Signed-off-by: Julien Riou <julien@riou.xyz> |
||
|---|---|---|
| docker | ||
| grafana | ||
| images | ||
| telegraf | ||
| .gitignore | ||
| docker-compose.yml | ||
| LICENSE | ||
| README.md | ||
Mining dashboards
Grafana dashboards for cryptocurrency miners.
Requirements
Dashboards rely on the following softwares:
- Telegraf to gather metrics (input) and write to a datastore (output)
- InfluxDB to store metrics on the long-term
- Grafana to visualize metrics
This stack is also known as the TIG stack.
Quickstart
Create infrastructure
Testing purpose only.
This guide uses Docker. Ensure you have docker, docker-compose and openssl binaries
installed.
Write grafana and influxdb credentials:
cp -p docker/environment.example docker/environment
vi docker/environment
Depending on inputs, you should also set the miner address and HiveOS token.
Generate a self-signed certificate:
openssl req -x509 -nodes -newkey rsa:2048 -keyout docker/ssl/my.key -out docker/ssl/my.crt -days 365
Press enter to every question.
Then start containers:
docker-compose up -d
See logs with:
docker-compose logs -f
Configure Telegraf
Telegraf inputs configurations are stored in telegraf directory. You can test them using the following command:
docker run --rm -e "MINER_ADDRESS=${MINER_ADDRESS}" \
    -v "${PWD}/docker/telegraf.conf:/etc/telegraf/telegraf.conf:ro" -v "${PWD}/telegraf:/etc/telegraf/telegraf.d:ro" \
    telegraf:1.15.4 telegraf -test -config /etc/telegraf/telegraf.conf -config-directory /etc/telegraf/telegraf.d
Example:
2021-02-02T14:39:57Z I! Starting Telegraf 1.15.4
> currencies,from=ETH,host=docker,to=EUR value=1171.49 1612276798000000000
> currencies,from=ETH,host=docker,to=USD value=1411.03 1612276798000000000
> flexpool_balance,host=docker,miner=0x3e2251567f87E4B6a3927158AF9c678ECa87a337 result=69375170480923064 1612276798000000000
> flexpool_workers,host=docker,miner=0x3e2251567f87E4B6a3927158AF9c678ECa87a337,name=rig1 effective_hashrate=86666666,invalid_shares=0,reported_hashrate=96304517,stale_shares=3,valid_shares=2008 1612276798000000000
> flexpool_daily_revenue_estimation,host=docker,miner=0x3e2251567f87E4B6a3927158AF9c678ECa87a337 result=6710141993155250 1612276798000000000
> flexpool_paid,host=docker,miner=0x3e2251567f87E4B6a3927158AF9c678ECa87a337 result=0 1612276798000000000
> flexpool_stats,host=docker,miner=0x3e2251567f87E4B6a3927158AF9c678ECa87a337 current_effective_hashrate=86666666,current_reported_hashrate=96304517,daily_effective_hashrate=92962962.625,daily_invalid_shares=0,daily_reported_hashrate=96286435.27777778,daily_stale_shares=3,daily_valid_shares=2008 1612276798000000000
Once you are confident with your configuration, reload the container:
docker-compose restart telegraf
Configure Grafana
Login
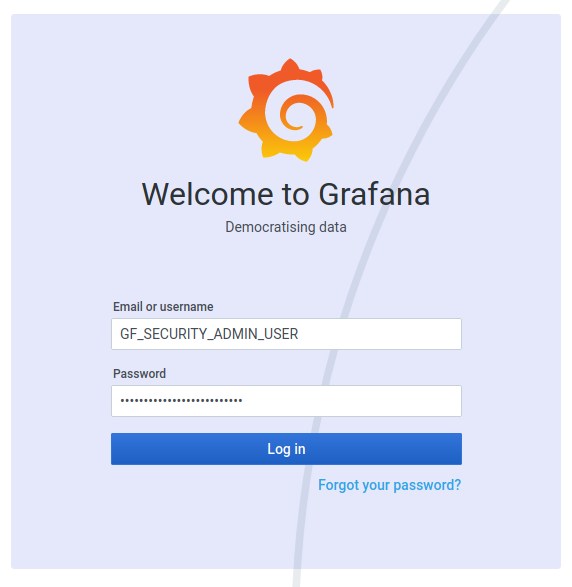
Go to Grafana URL. Login with credentials set in the "Create infrastructure" section.
Add a datasource
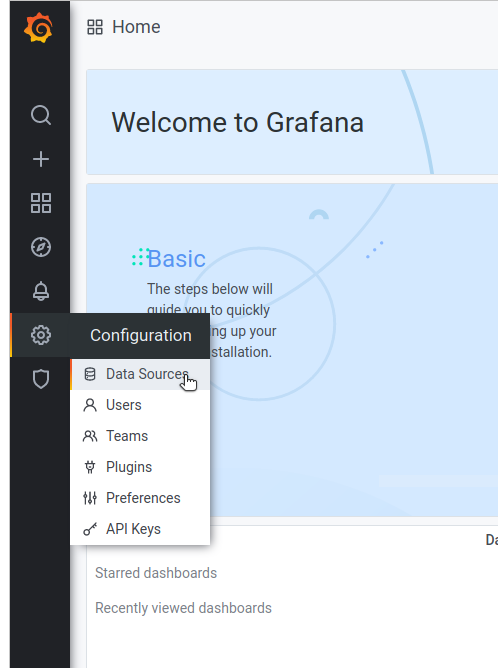
Go to Configuration, Data Sources:
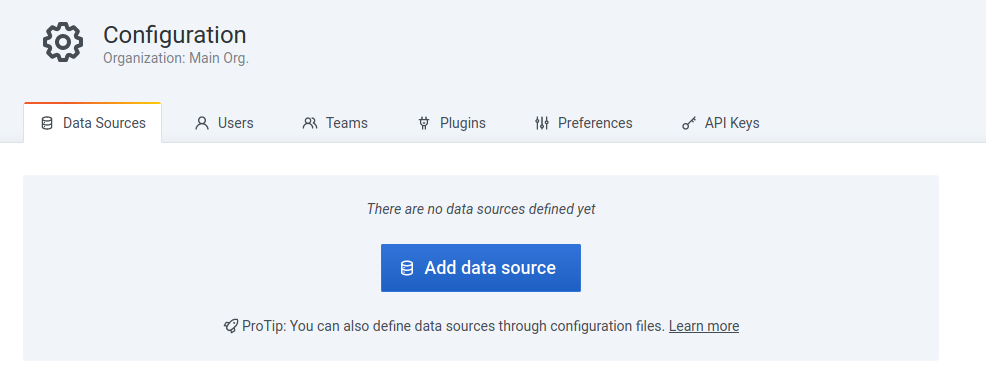
Select on Add data source:
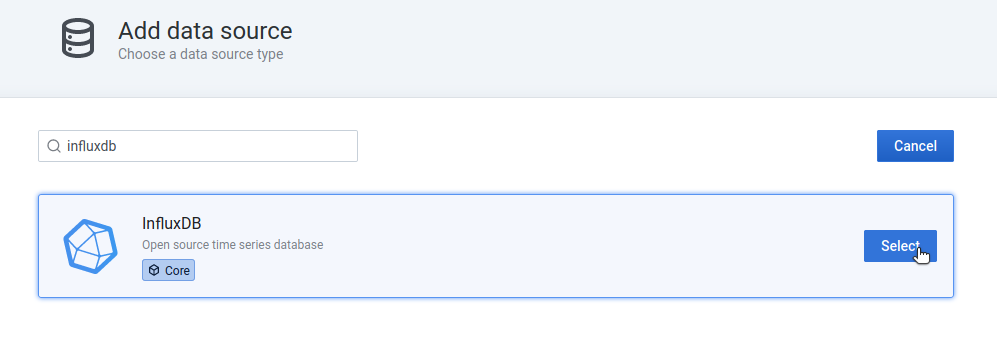
Search for InfluxDB:
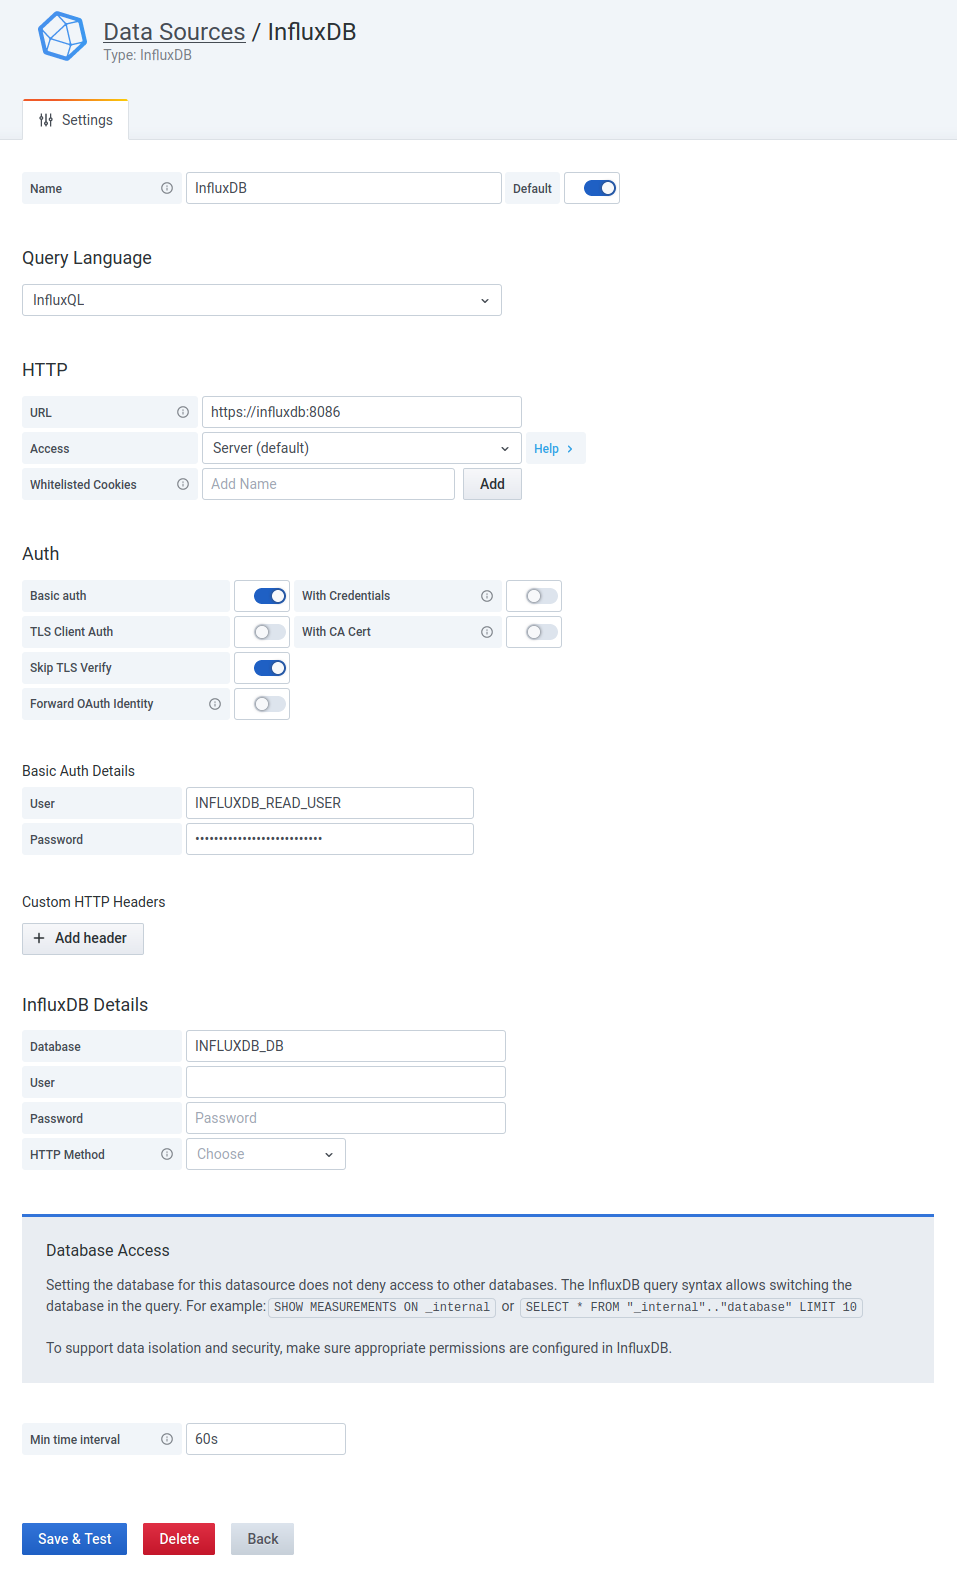
Then add read-only credentials to access the InfluxDB data store:
- Name:
InfluxDB - URL:
https://influxdb:8086 - Basic auth: enabled
- Skip TLS Verify: enabled
- User: defined by
INFLUXDB_READ_USER - Password: defined by
INFLUXDB_READ_USER_PASSWORD - Min time interval:
60s(Telegraf interval)
Click on Save & Test:
Import dashboard
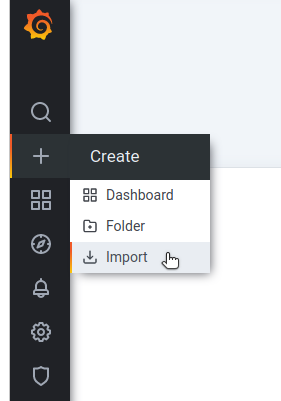
Click on Import:
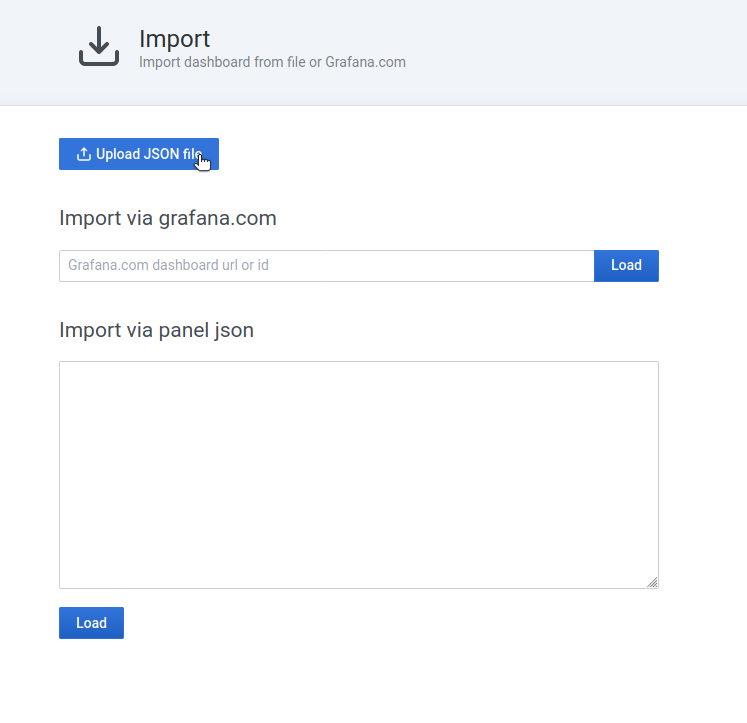
Then upload JSON file from this repository:
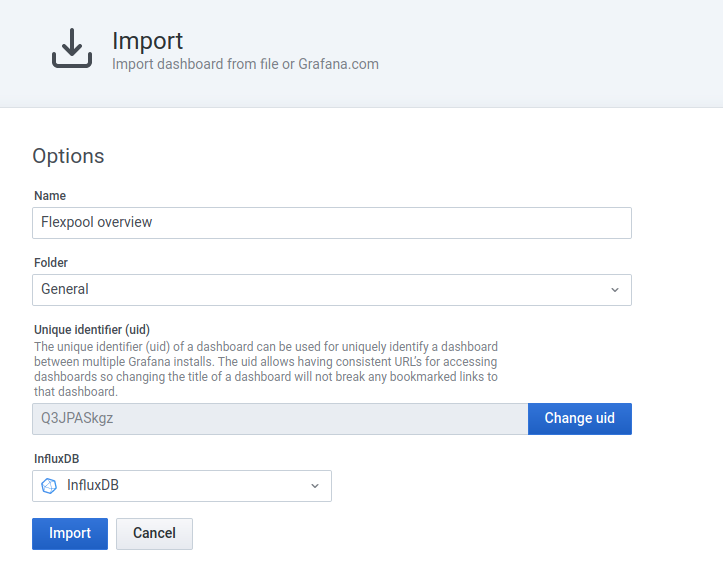
Select InfluxDB data source and click on Import:
Your dashboard should be imported!
Repeat the operation for other dashboards if needed.
Remove infrastructure
Use docker-compose to remove containers and their volumes:
docker-compose down -v
Disclaimer
Telegraf is able to make API call on thrid-party services. Please read terms of service before going further. The repository owner cannot be responsible of any abuse.
